Documentation
Contents
BiQ Analyzer HiMod Documentation
| |
|
| BiQ Analyzer Classic Documentation
|
BiQ Analyzer HiMod Documentation
1. Configuration and Preparation of the Sequencing Data
|
For a basic analysis run BiQ Analyzer does not require any configuration. In a typical experimental scenario several target amplicon are amplified from bisulfite treated DNA of each considered sample. BiQ Analyzer assumes that the sequence reads obtained for each sample-amplicon combination of a Bisulfite project are separated and stored in a single FASTA or FASTQ file, while the sequence reads obtained for each sample-amplicon combination of a project combining two sequencing methods like Oxidative Bisulfite analysis are stored in two files. One for each sequencing approach. As the number of available sequencing platforms continues to grow the platform-specific data preparation steps were not included into BiQ Analyzer and users should rely upon the software deployed together with the sequencing machines and custom scripts. Since the exact multiplexing strategy is experiment-specific and hard to generalize, BiQ requires the direct sequencing output to be demultiplexed using the available third-party tools. We recommend the Galaxy barcode splitter as an adequate solution Alternatively, BiQ Analyzer supports loading of the mapped reads from genome-wide sequencing experiments. The reads should be stored in SAM(BAM) files, one file per analyzed sample. |
2. Analysis
|
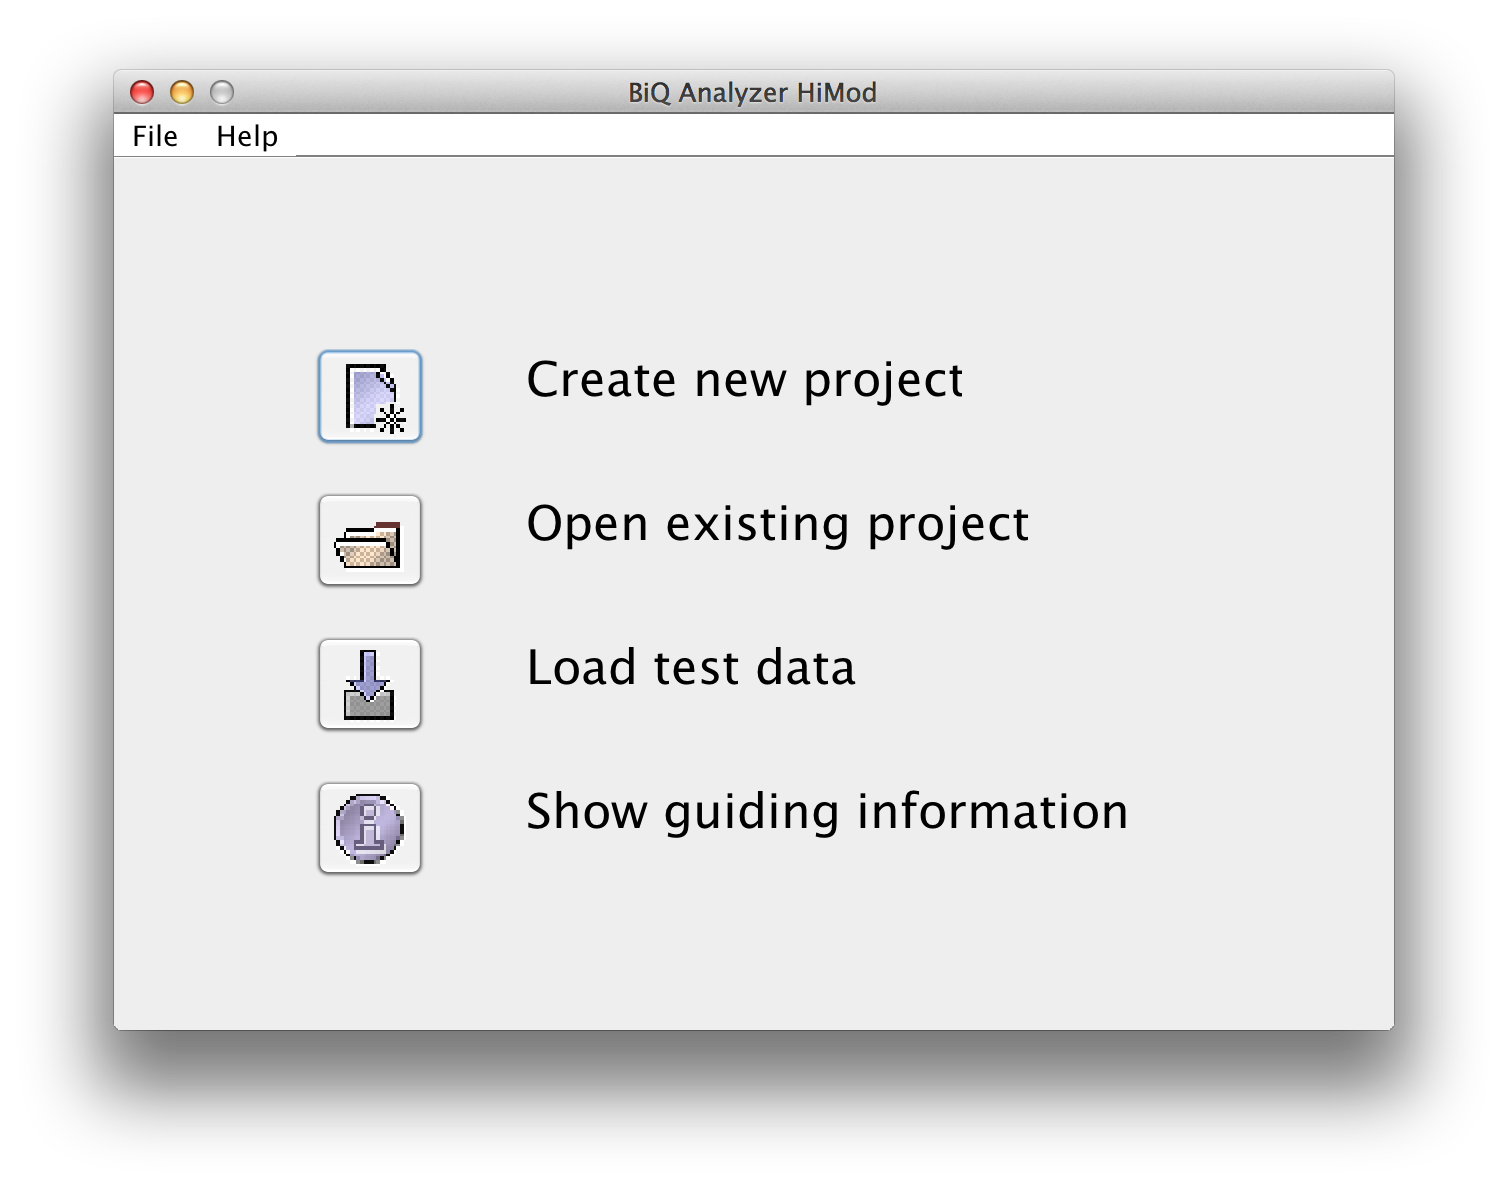
BiQ Analyzer starts with a welcome panel providing several possibilities to proceed. At the bottom of the panel a short guidance information is given. "New project" button leads to the dialogue that helps you to select an output directory for the new analysis project. Before selecting it please verify that the location is accessible for writing and there is enough space on the corresponding storage device. Alternatively an existing project can be opened by pressing "Open project" and selecting the output directory of an existing analysis project. The latter should contain a file "biqanalyzerht.xml" which is written to the output directory when the analysis project is saved. |
|
 please click on the image to enlarge |
|
|
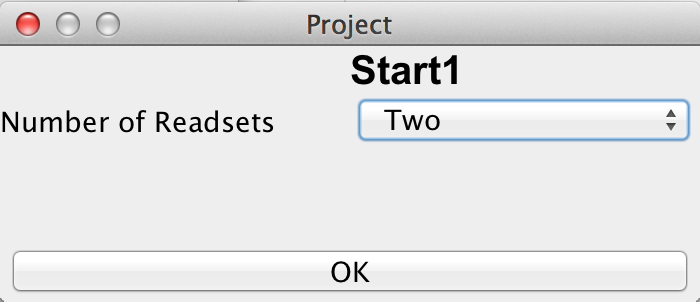
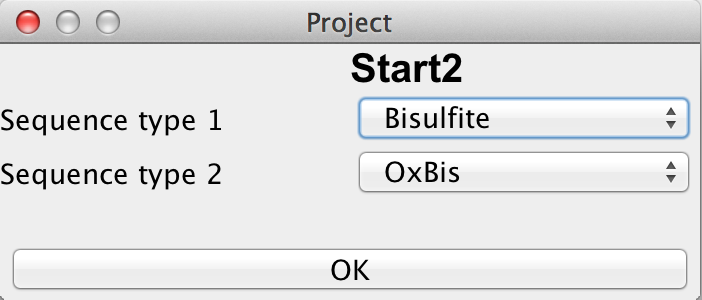
If the user has chosen a new project and selected a directory, it is necessary to define the type of this new project by choosing the number of readsets per sample per amplicon and selecting the sequencing approach used to obtain these readsets. The first sequencing approach has to be "Bisulfite Sequencing" while the user can choose between "Oxidative Bisulifite Sequencing (oxBS)", "TET assisted Bisulfite Sequencing (TAB)", "Chemical Modification-Assisted Bisulfite Sequencing (CAB)" and "Formyl Chemical Modification-Assisted Bisulfite Sequencing (f-CAB)" for the second. |
|
 please click on the image to enlarge |
|
 please click on the image to enlarge |
|
|
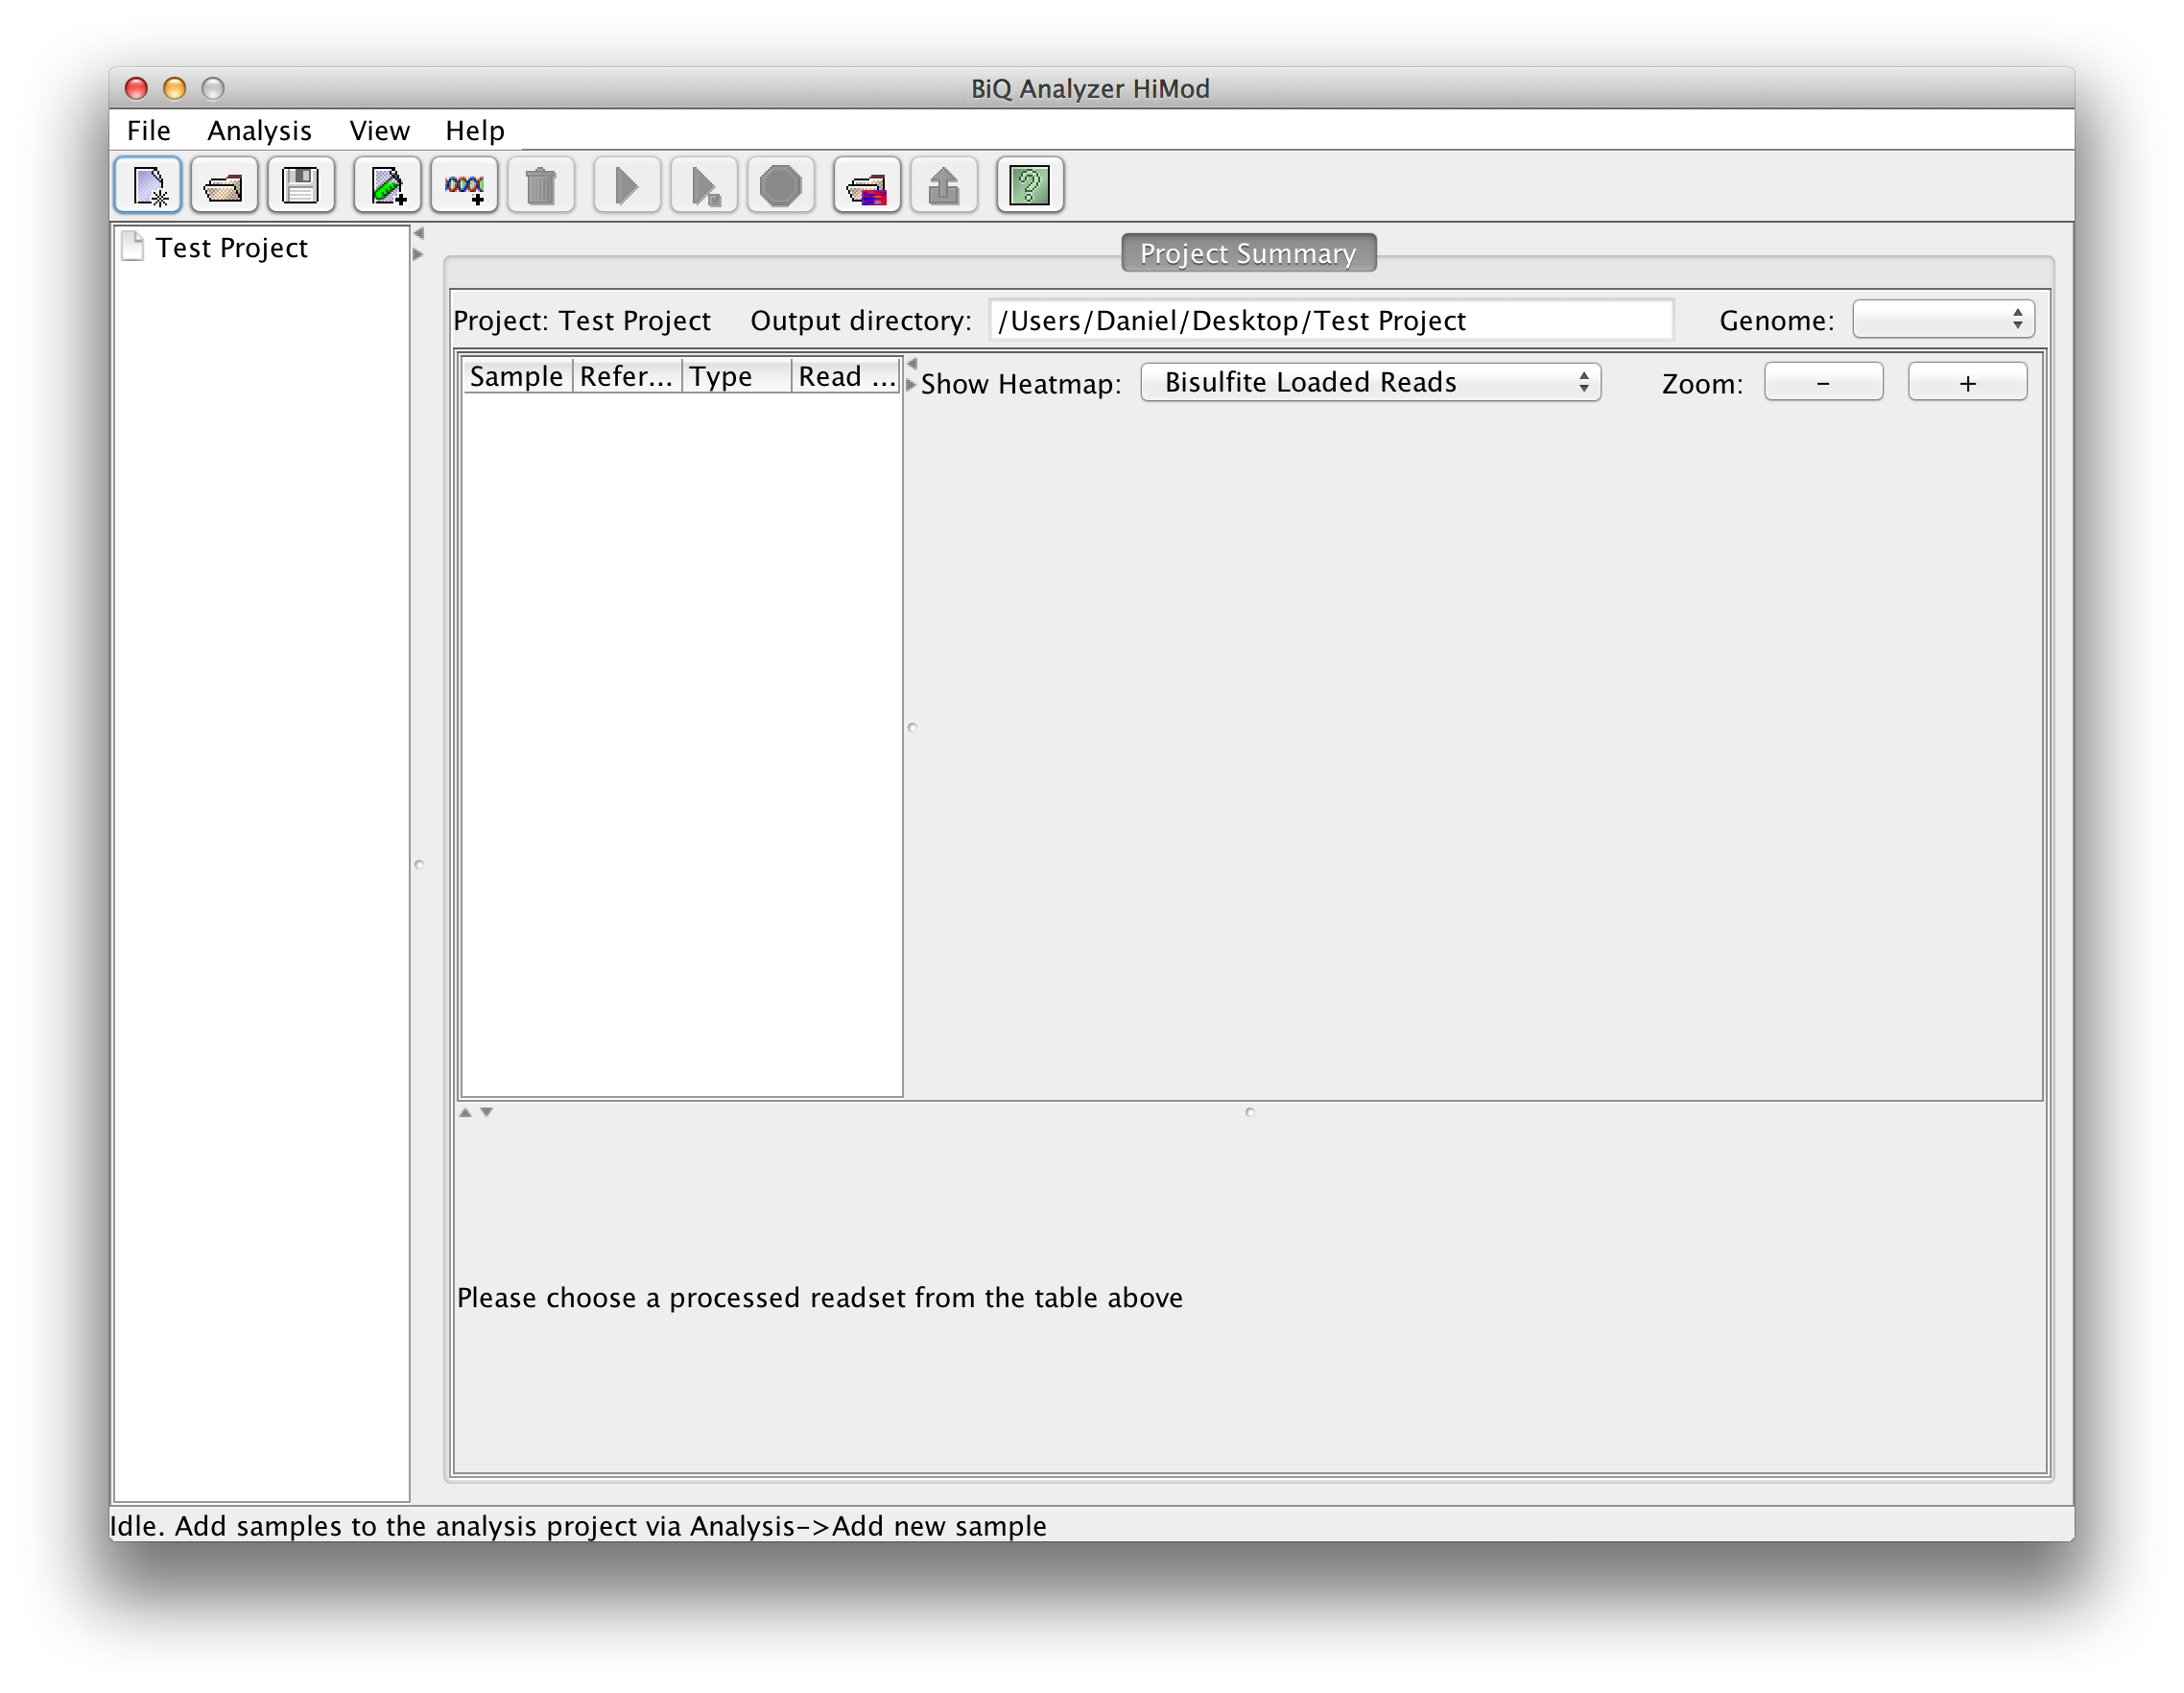
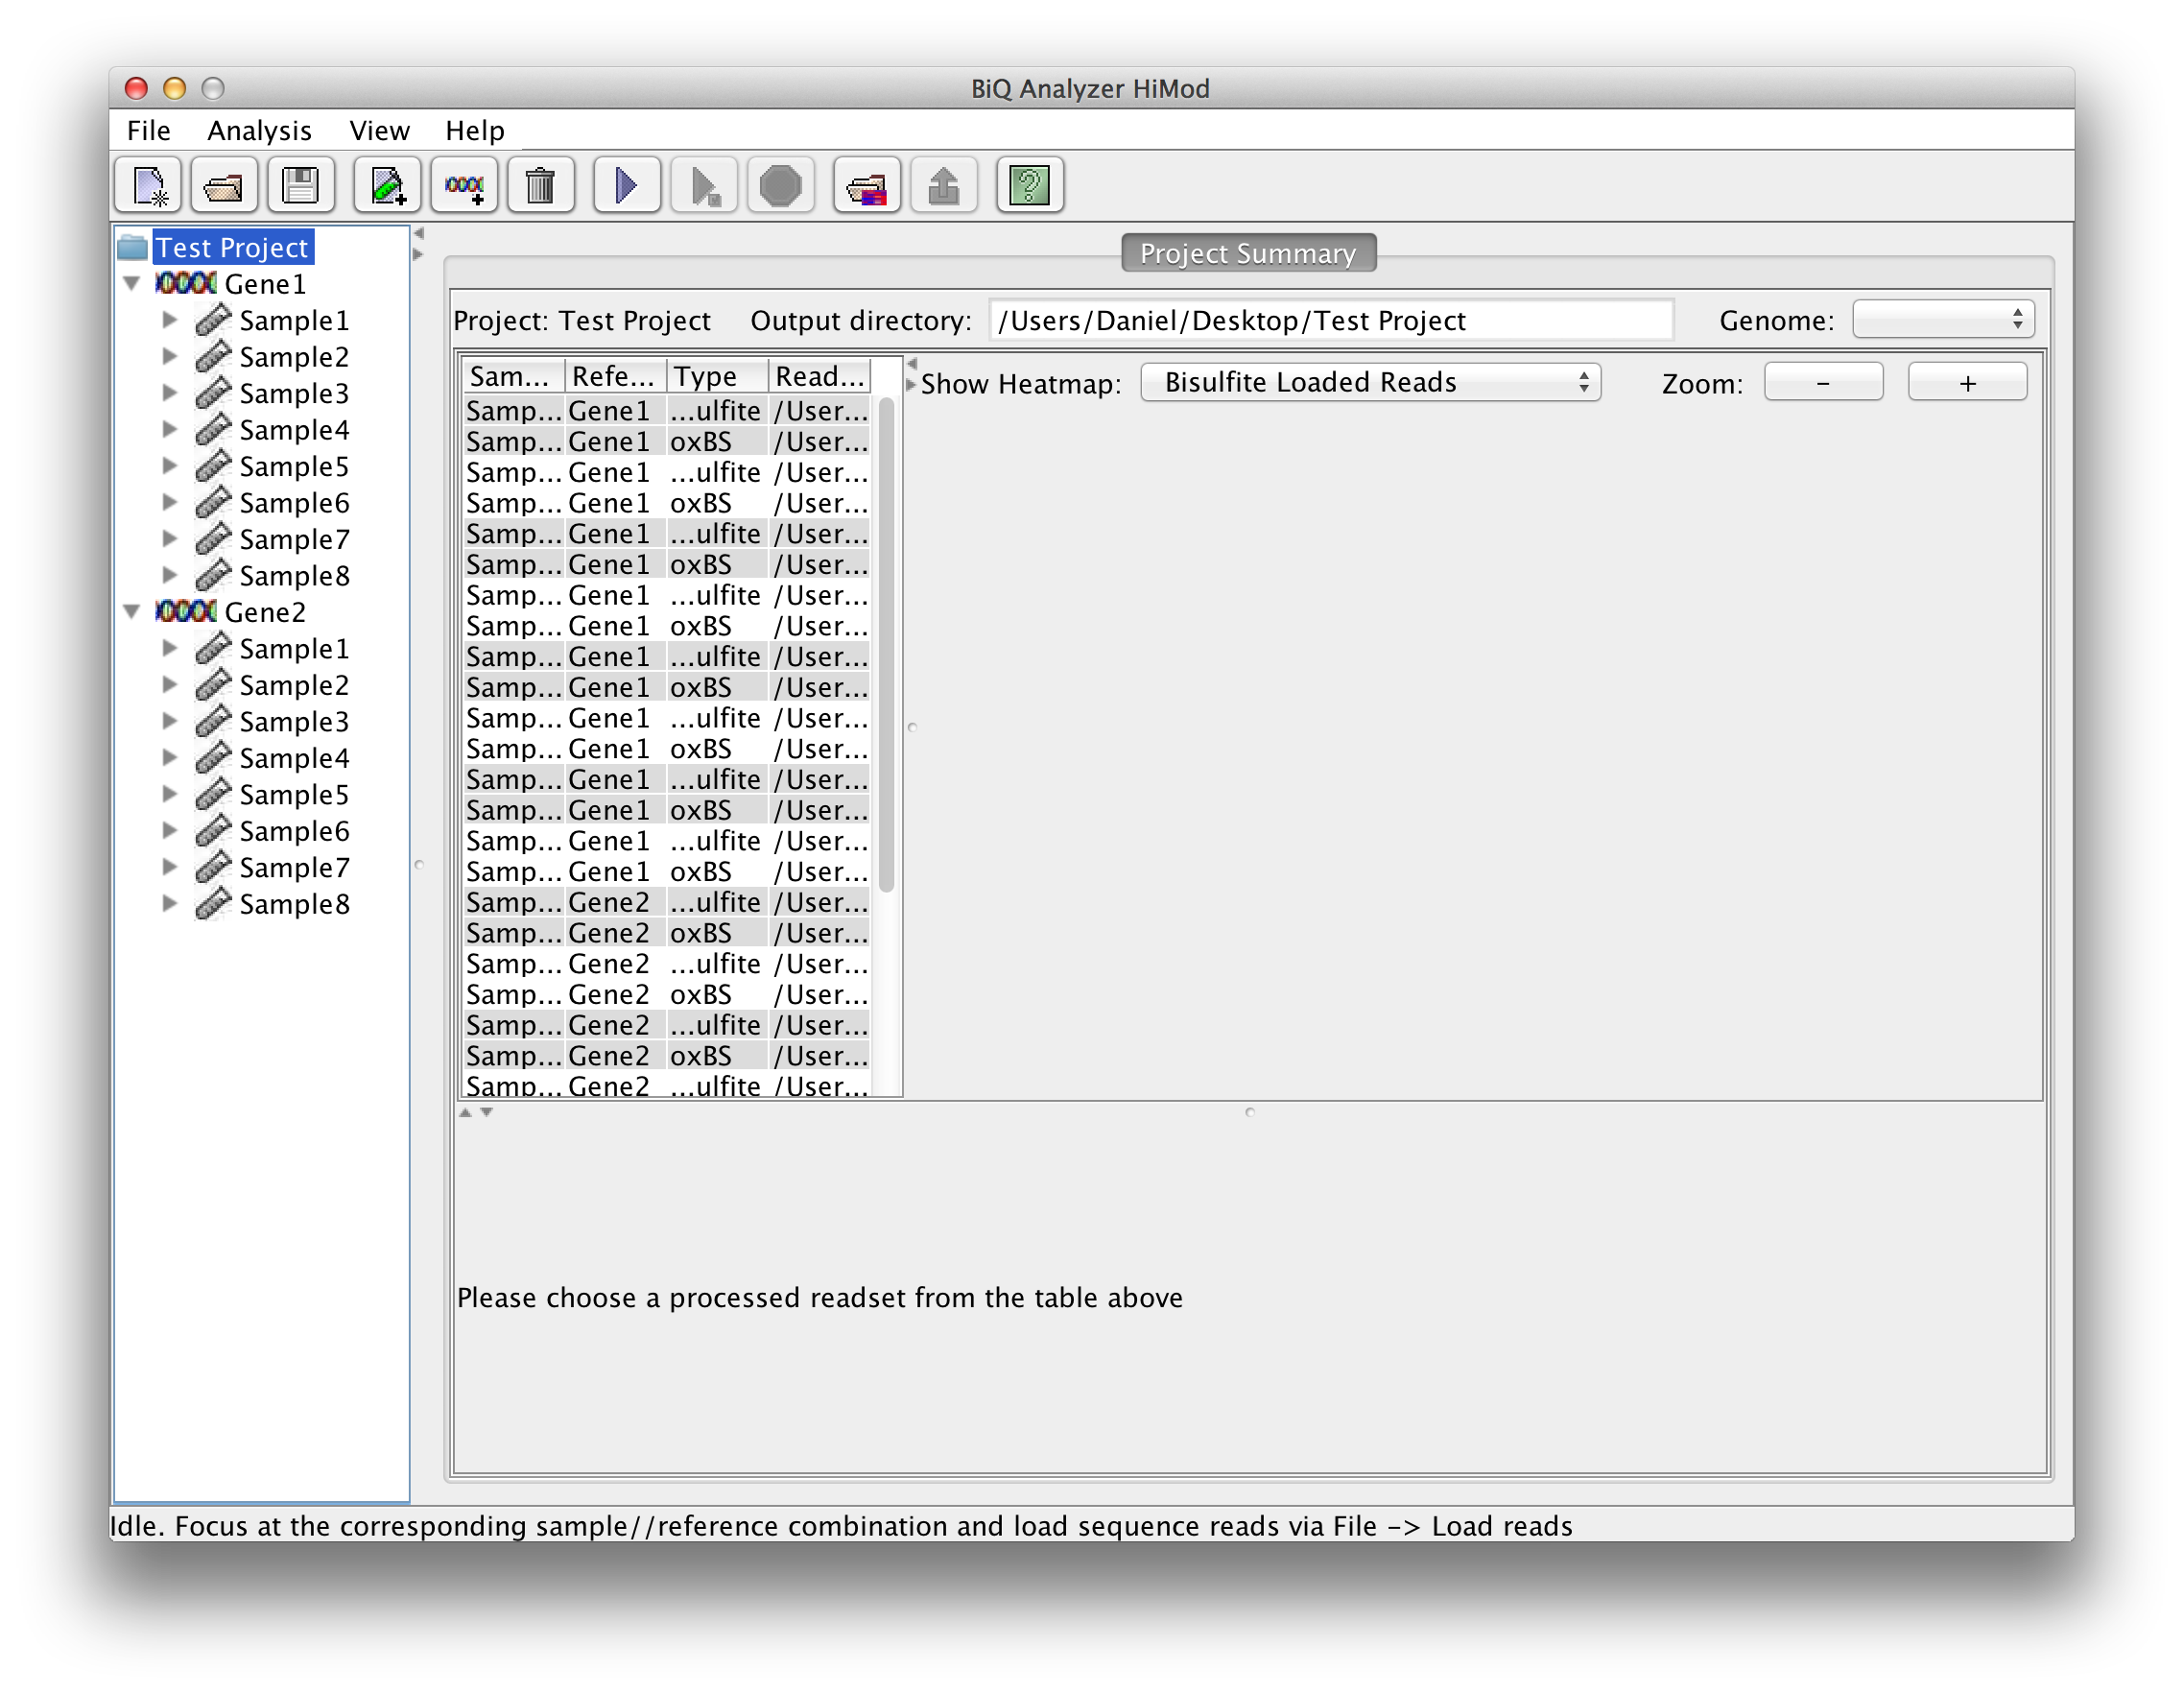
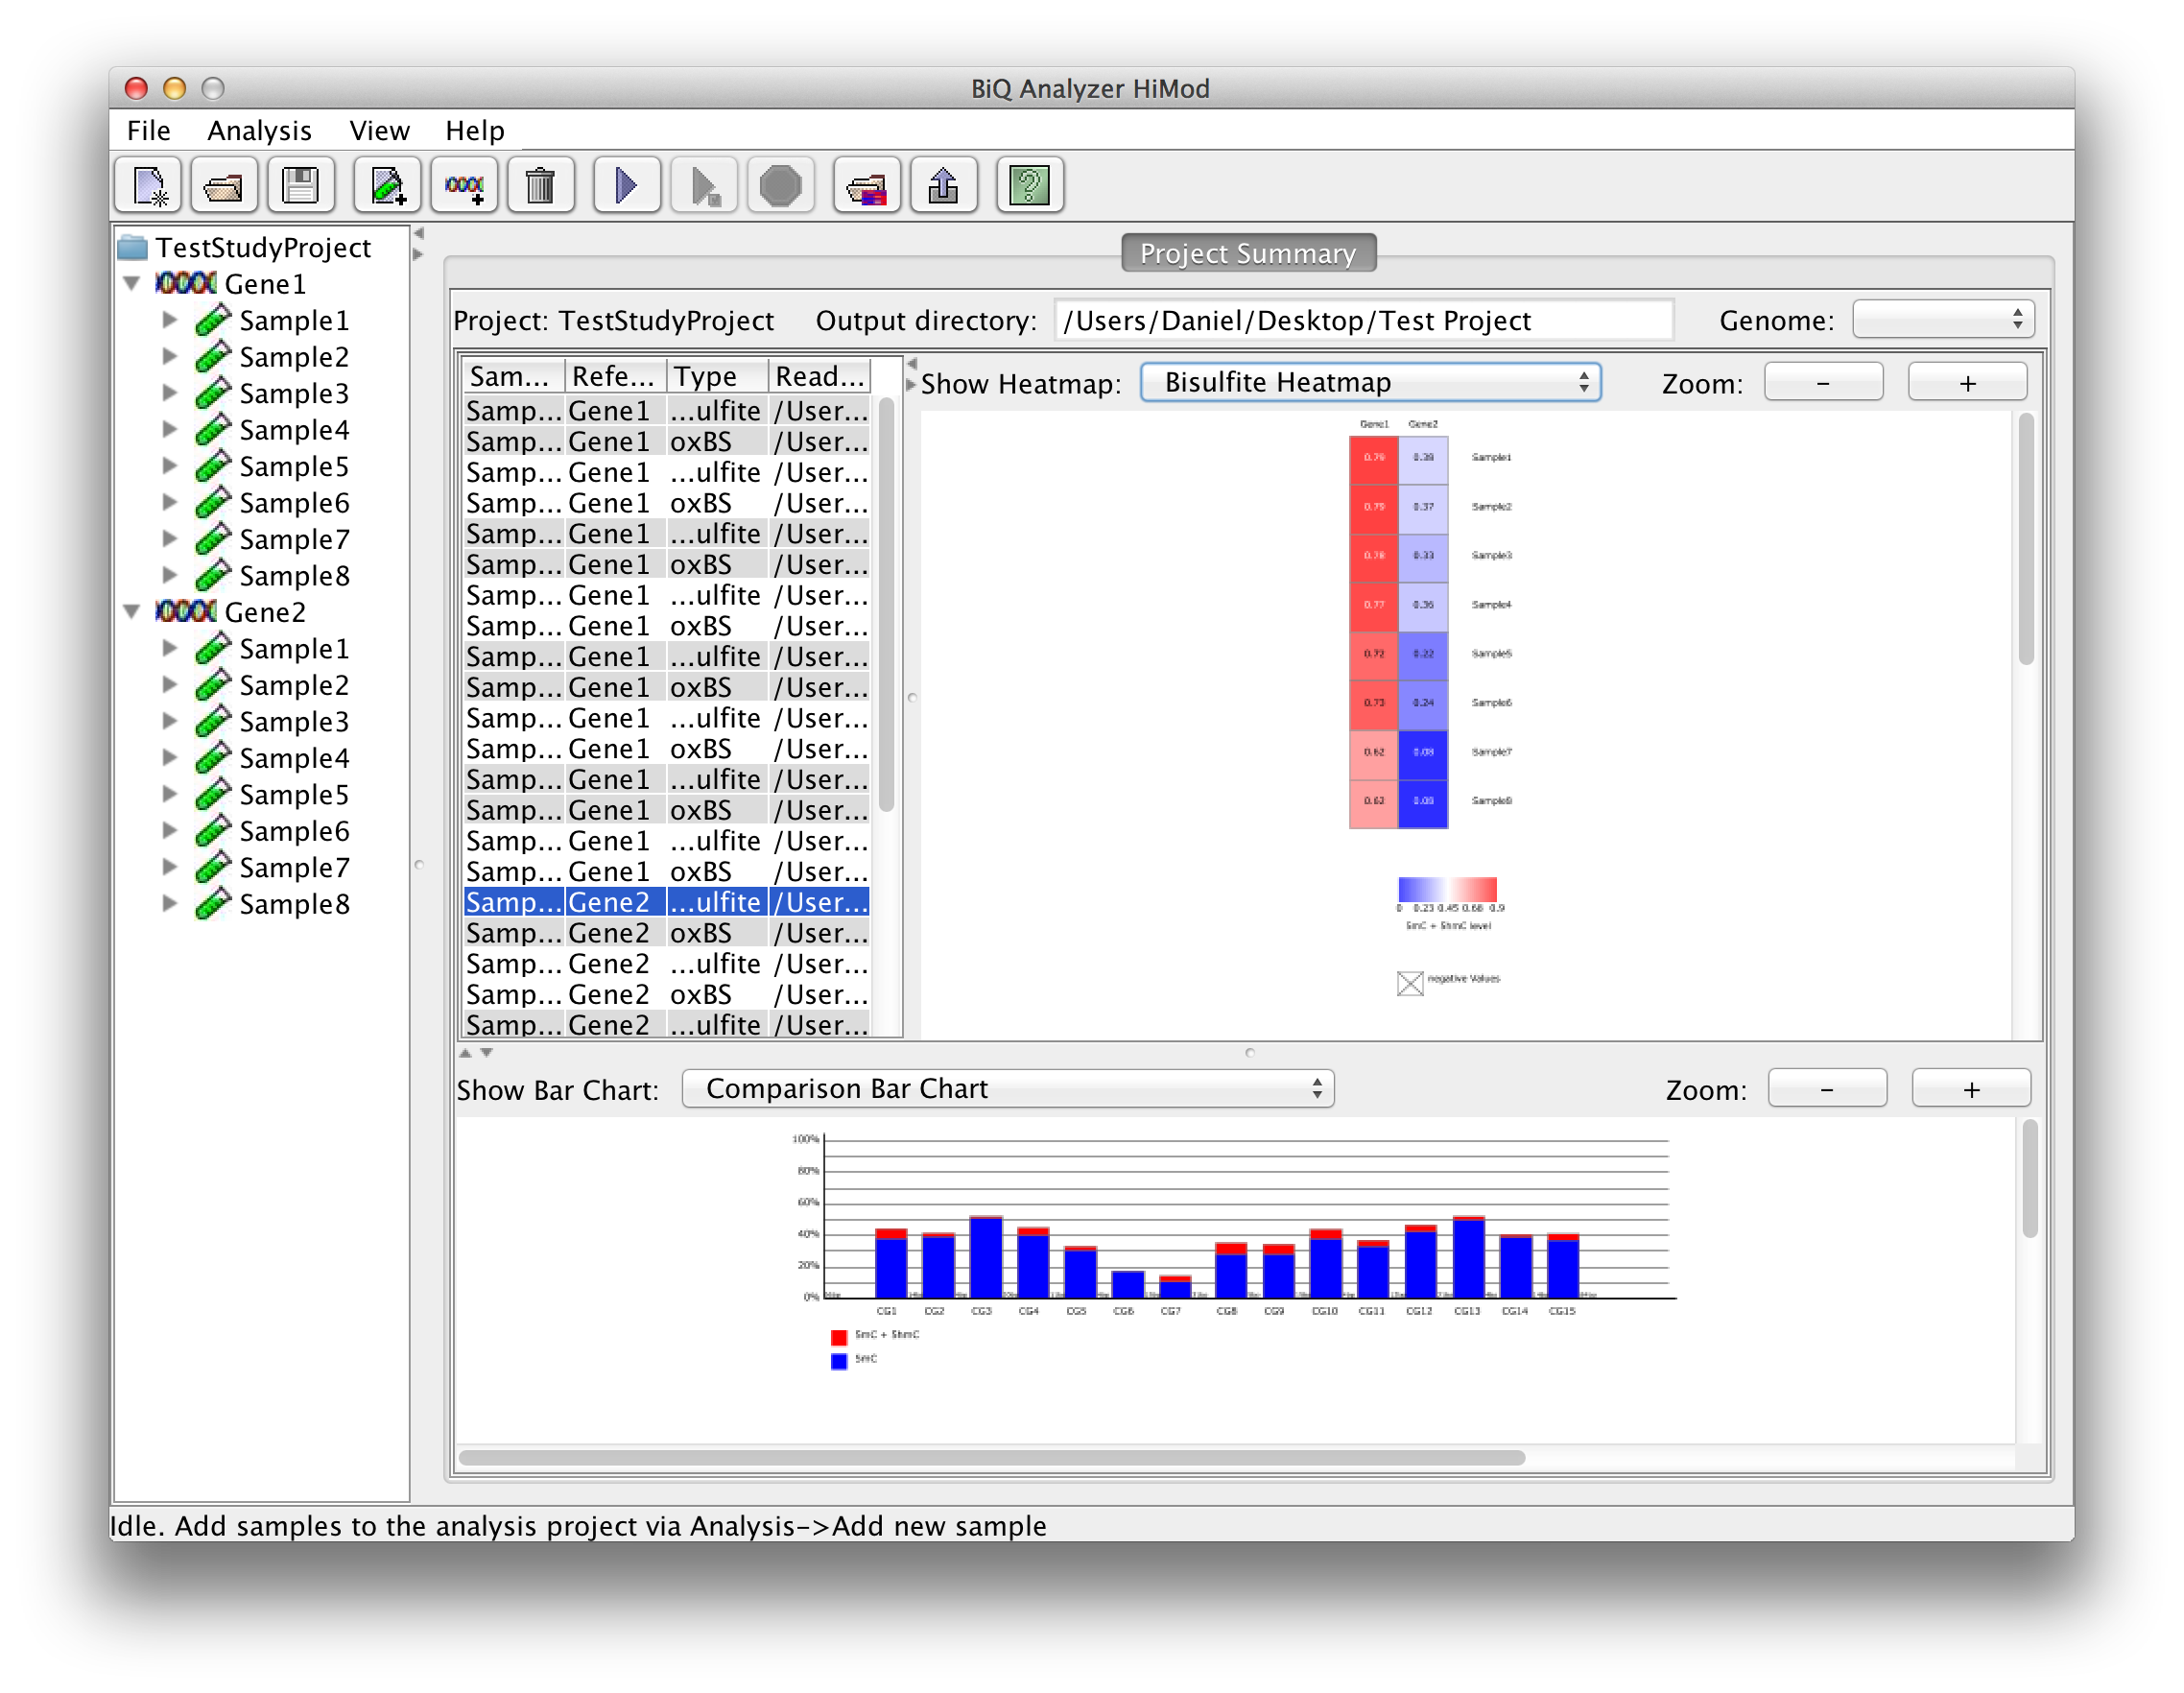
After the directory has been selected the BiQ Analyzer workspace is initialized. The summary of the newly created project is given in a corresponding tab of the main panel. The Overview of the project is divided in three parts. On the upper left one can see a table with basic information for every sample and reference sequence combination. On the upper right the different mean methylation heatmaps are displayed. One for each sequencing approach and one for the difference between those two. The lower panel shows a graphical summary of a readset selected in the table. |
|
 please click on the image to enlarge |
2.0 Loading test data
|
BiQ Analyzer comes with various test data sets. Those can be loaded either by clicking "Load test data" on the welcome panel or selecting the corresponding item in menu "File". There are artificially generated test datasets for all five supported analysis types which all include data for three amplicons in three test samples. Furthermore one can also load a test set containing real biological data for OxBS-seq. This data set consists of two amplicons and eight samples. Alternatively the test data can be downloaded here and imported manually as described in Part 2.1 Working with those data sets gives a first impression of BiQ Analyzer and can be used to familiarize with the functions, settings and different output files. |
2.1 Preparation of the analysis project and loading data
|
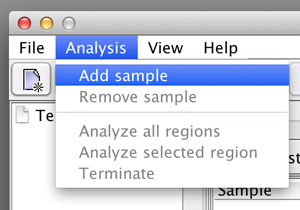
First add the required number of samples to the project by selecting the "Add sample" option in the "Analysis" menu. Each time you have to specify a name and the according sample is added to the list. |
|
 please click on the image to enlarge 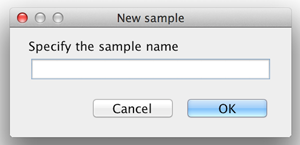 please click on the image to enlarge |
|
|
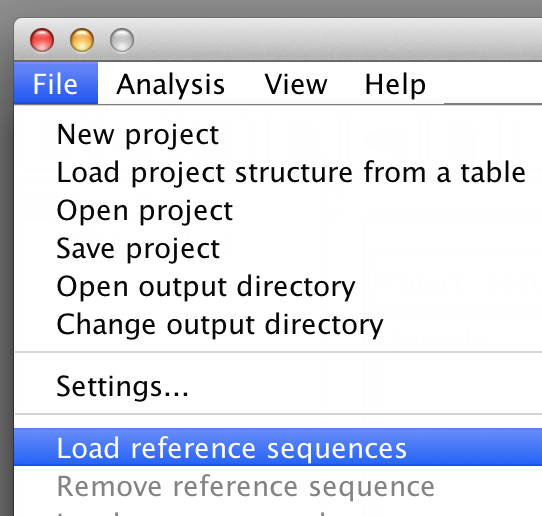
Once the project has at least one sample load reference sequences via "File"->"Load reference sequences". BiQ Analyzer requires genomic (not in silico bisulfite converted!) reference sequences of the sequenced loci, where the potential methylation sites can be easily detected. The reference should originate from the DNA strand which was actually amplified after the bisulfite conversion. Each loaded reference will be added to each sample in the project. BiQ Analyzer supports two ways of structuring the analysis project: either by samples or by reference sequences. The alternative views can be switched via the "Organize by" item in menu "View". Once the project is organized by samples a sample summary pane is accessible when the focus of the project tree is at the sample nodes. The sample summary panel includes a subset of the project summary panel with the rows relevant to the current. Similarly, the reference summary panel is accessible when the project is structured by references. |
|
 please click on the image to enlarge |
|
|
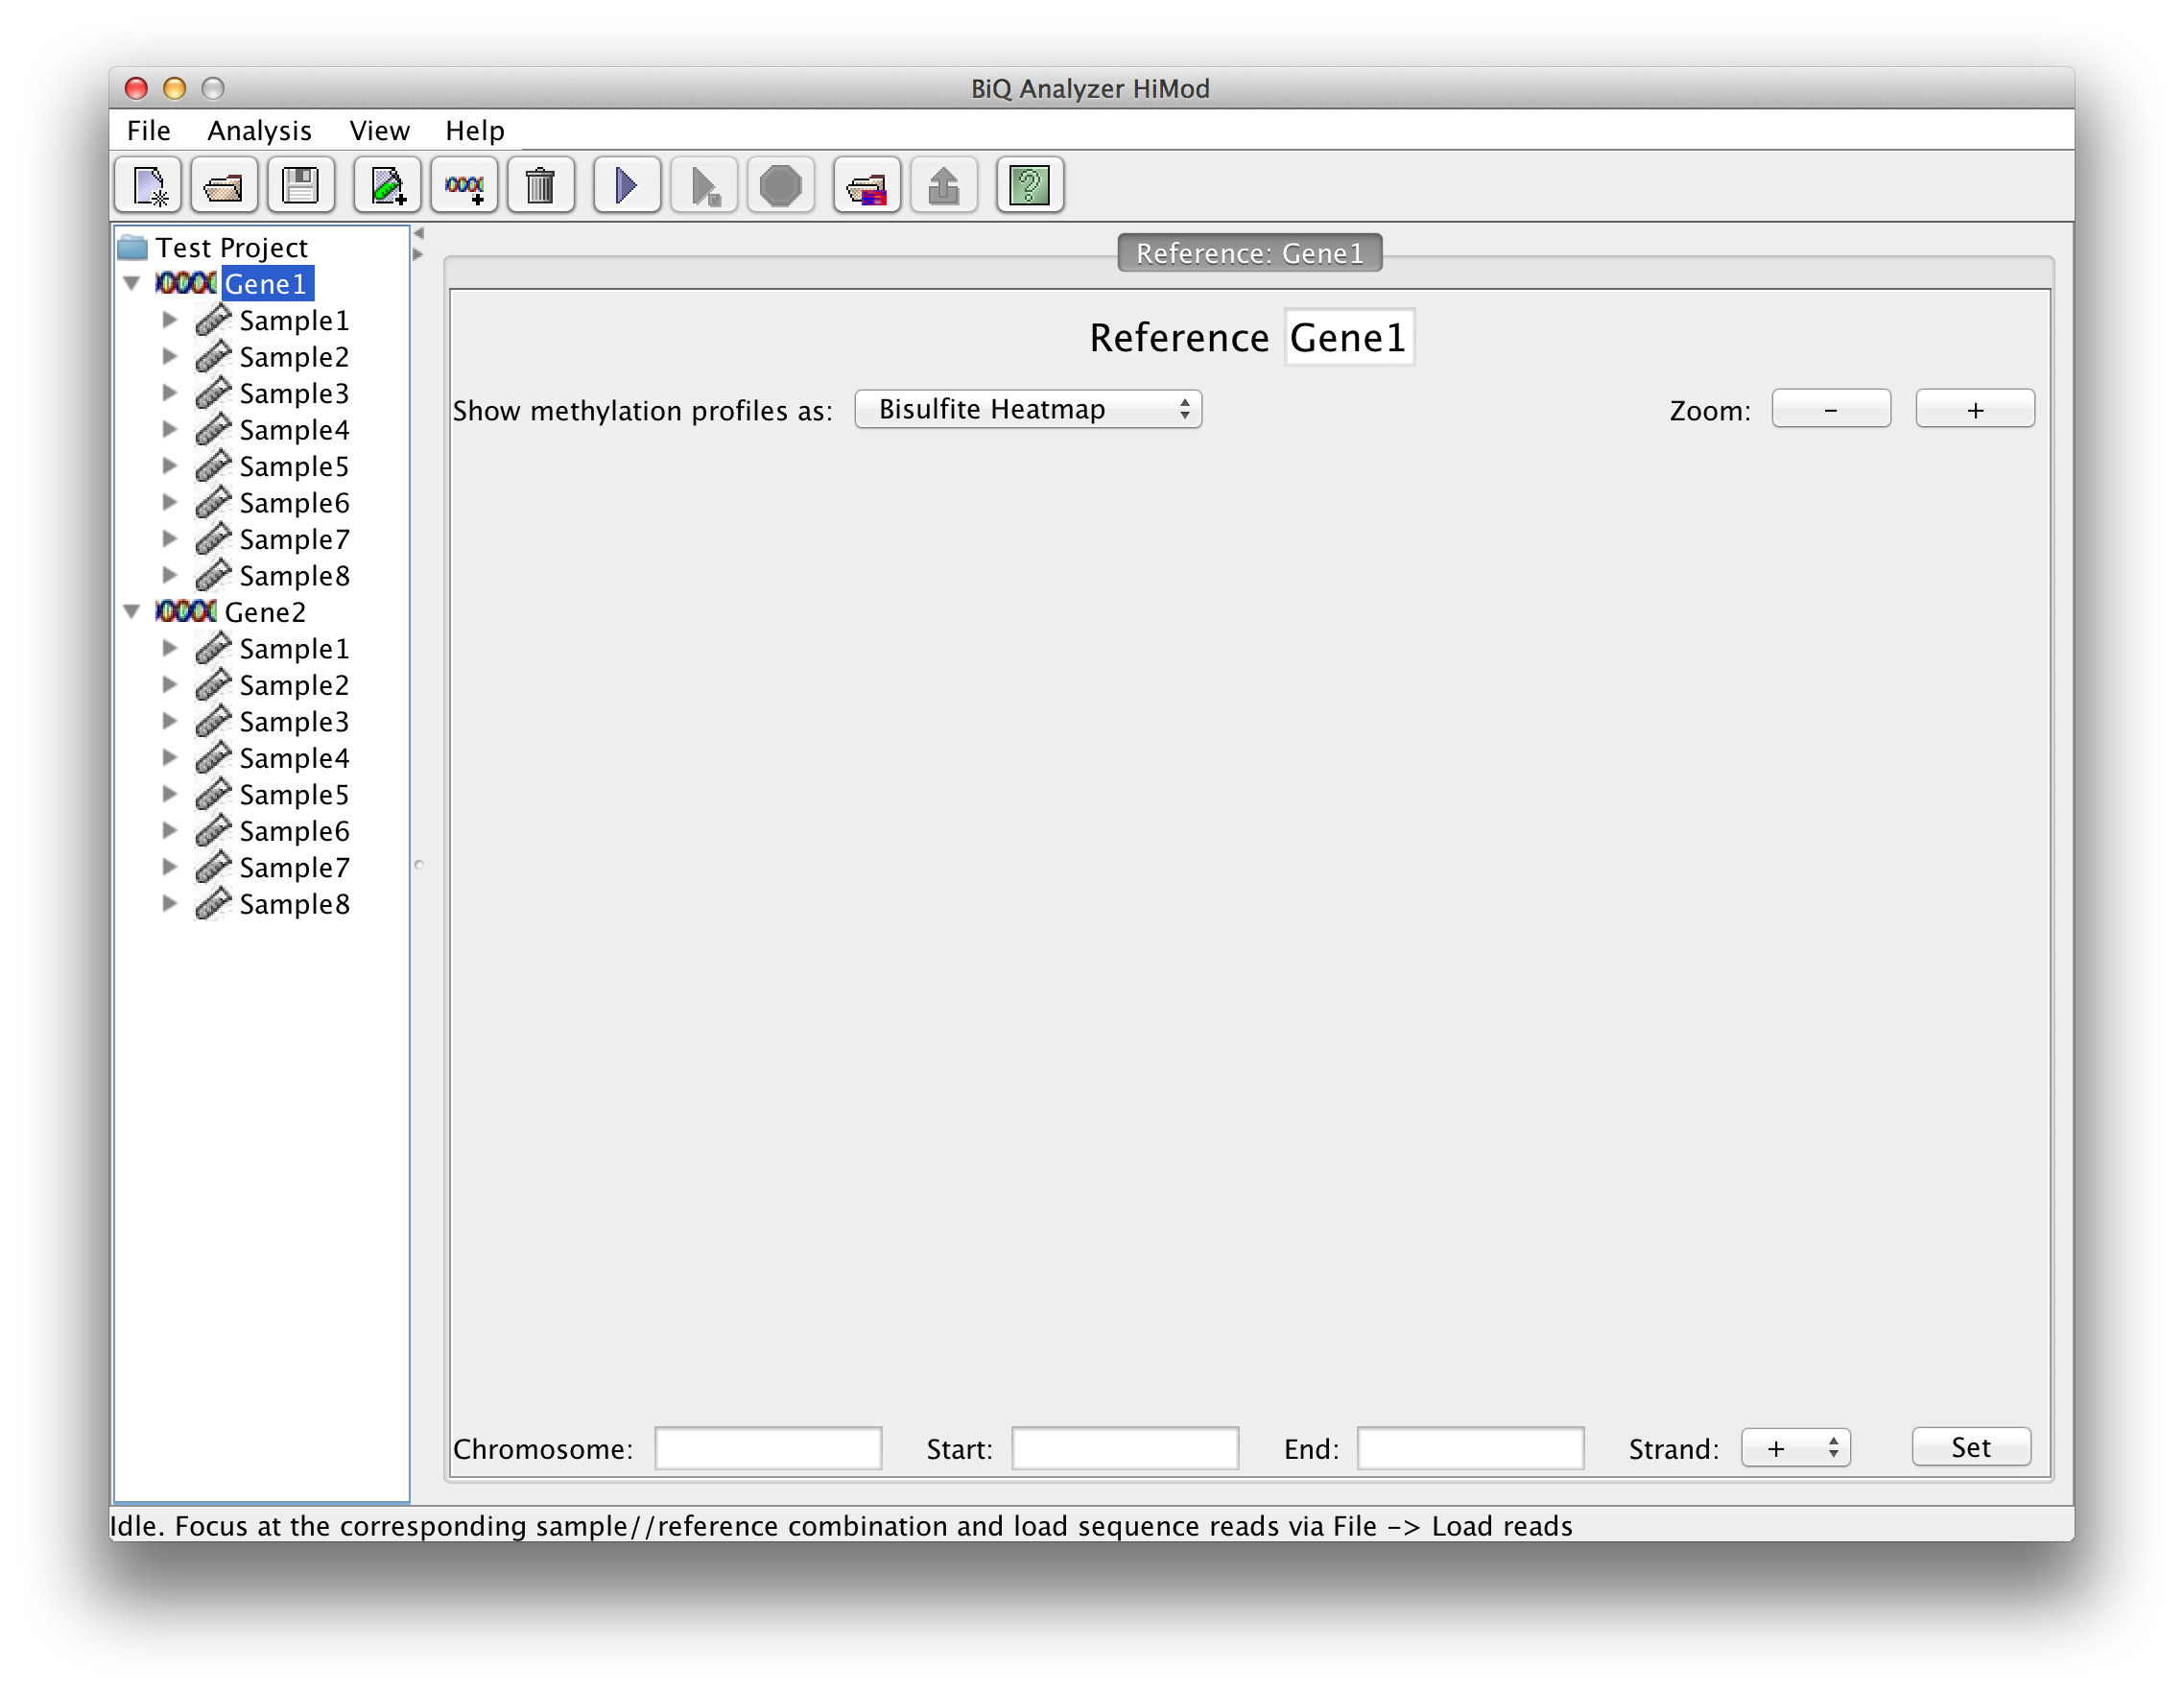
Each loaded reference can be assigned to an existing genomic location by specifying the coordinates and the strand of a corresponding genomic region. The respective form is located in the reference summary panel. The genomic location can also be fetched from the FASTA/FASTQ header. For that the header should contain the location in the form "range=chrN:NNNNNN-NNNNNNN" or "_chrN_NNNNNNN_NNNNNNN_+"(the latter coordinate specification is default for the Fetch Sequences tool of the Galaxy toolkit). |
|
 please click on the image to enlarge |
|
|
Before loading into BiQ Analyzer the sequence reads should be prepared, i.e. the initial set of sequence reads from the sequencing machine should be split into batches by sample and reference sequence – one multi-sequence Fasta or Fastq file for each sample/reference combination. This is done by matching the sample-specific sequence tags and primer sequences in the read sequences. (In case the sequencing was done on a FLX (Roche 454) System this can be done with the sff-tools included in the analysis software package. In other cases we recommend the Galaxy barcode splitter as an adequate solution.) The files containing the reads can be loaded into BiQ Analyzer in two ways.
As in most of the high-throughput sequencing technologies the submitted DNA fragments are sequenced in both directions, each loaded read set can contain reads with opposite orientation. BiQ Analyzer alignment algorithm automatically corrects the orientation of each read by aligning both the original read and its reverse complement to the reference sequence and selecting the variant giving higher alignment score. Finally, the project data can be loaded into BiQ Analyzer as a table prepared in user's favorite spreadsheet editor. The table should be stored in a tab-separated plain text file and have - in case of a bisulfite analysis - three and - in the other cases - four columns: a column with sample identifiers, a column with full paths to the reference sequence FASTA/FastQ files, a column with full paths to the corresponding FASTA/FastQ files with the first sequence reads and a column with full paths to the corresponding FASTA/FastQ files with the second sequence reads if needed for the used analysis type. Thus the number of rows in the table should be at most the number of samples multiplied with the number of references in the project (or the total number of available files with reads). The table should also have a header (BiQ Analyzer will skip the first row in the opposite case). An example can be found here |
|
 please click on the image to enlarge |
2.2 Setting up the analysis
|
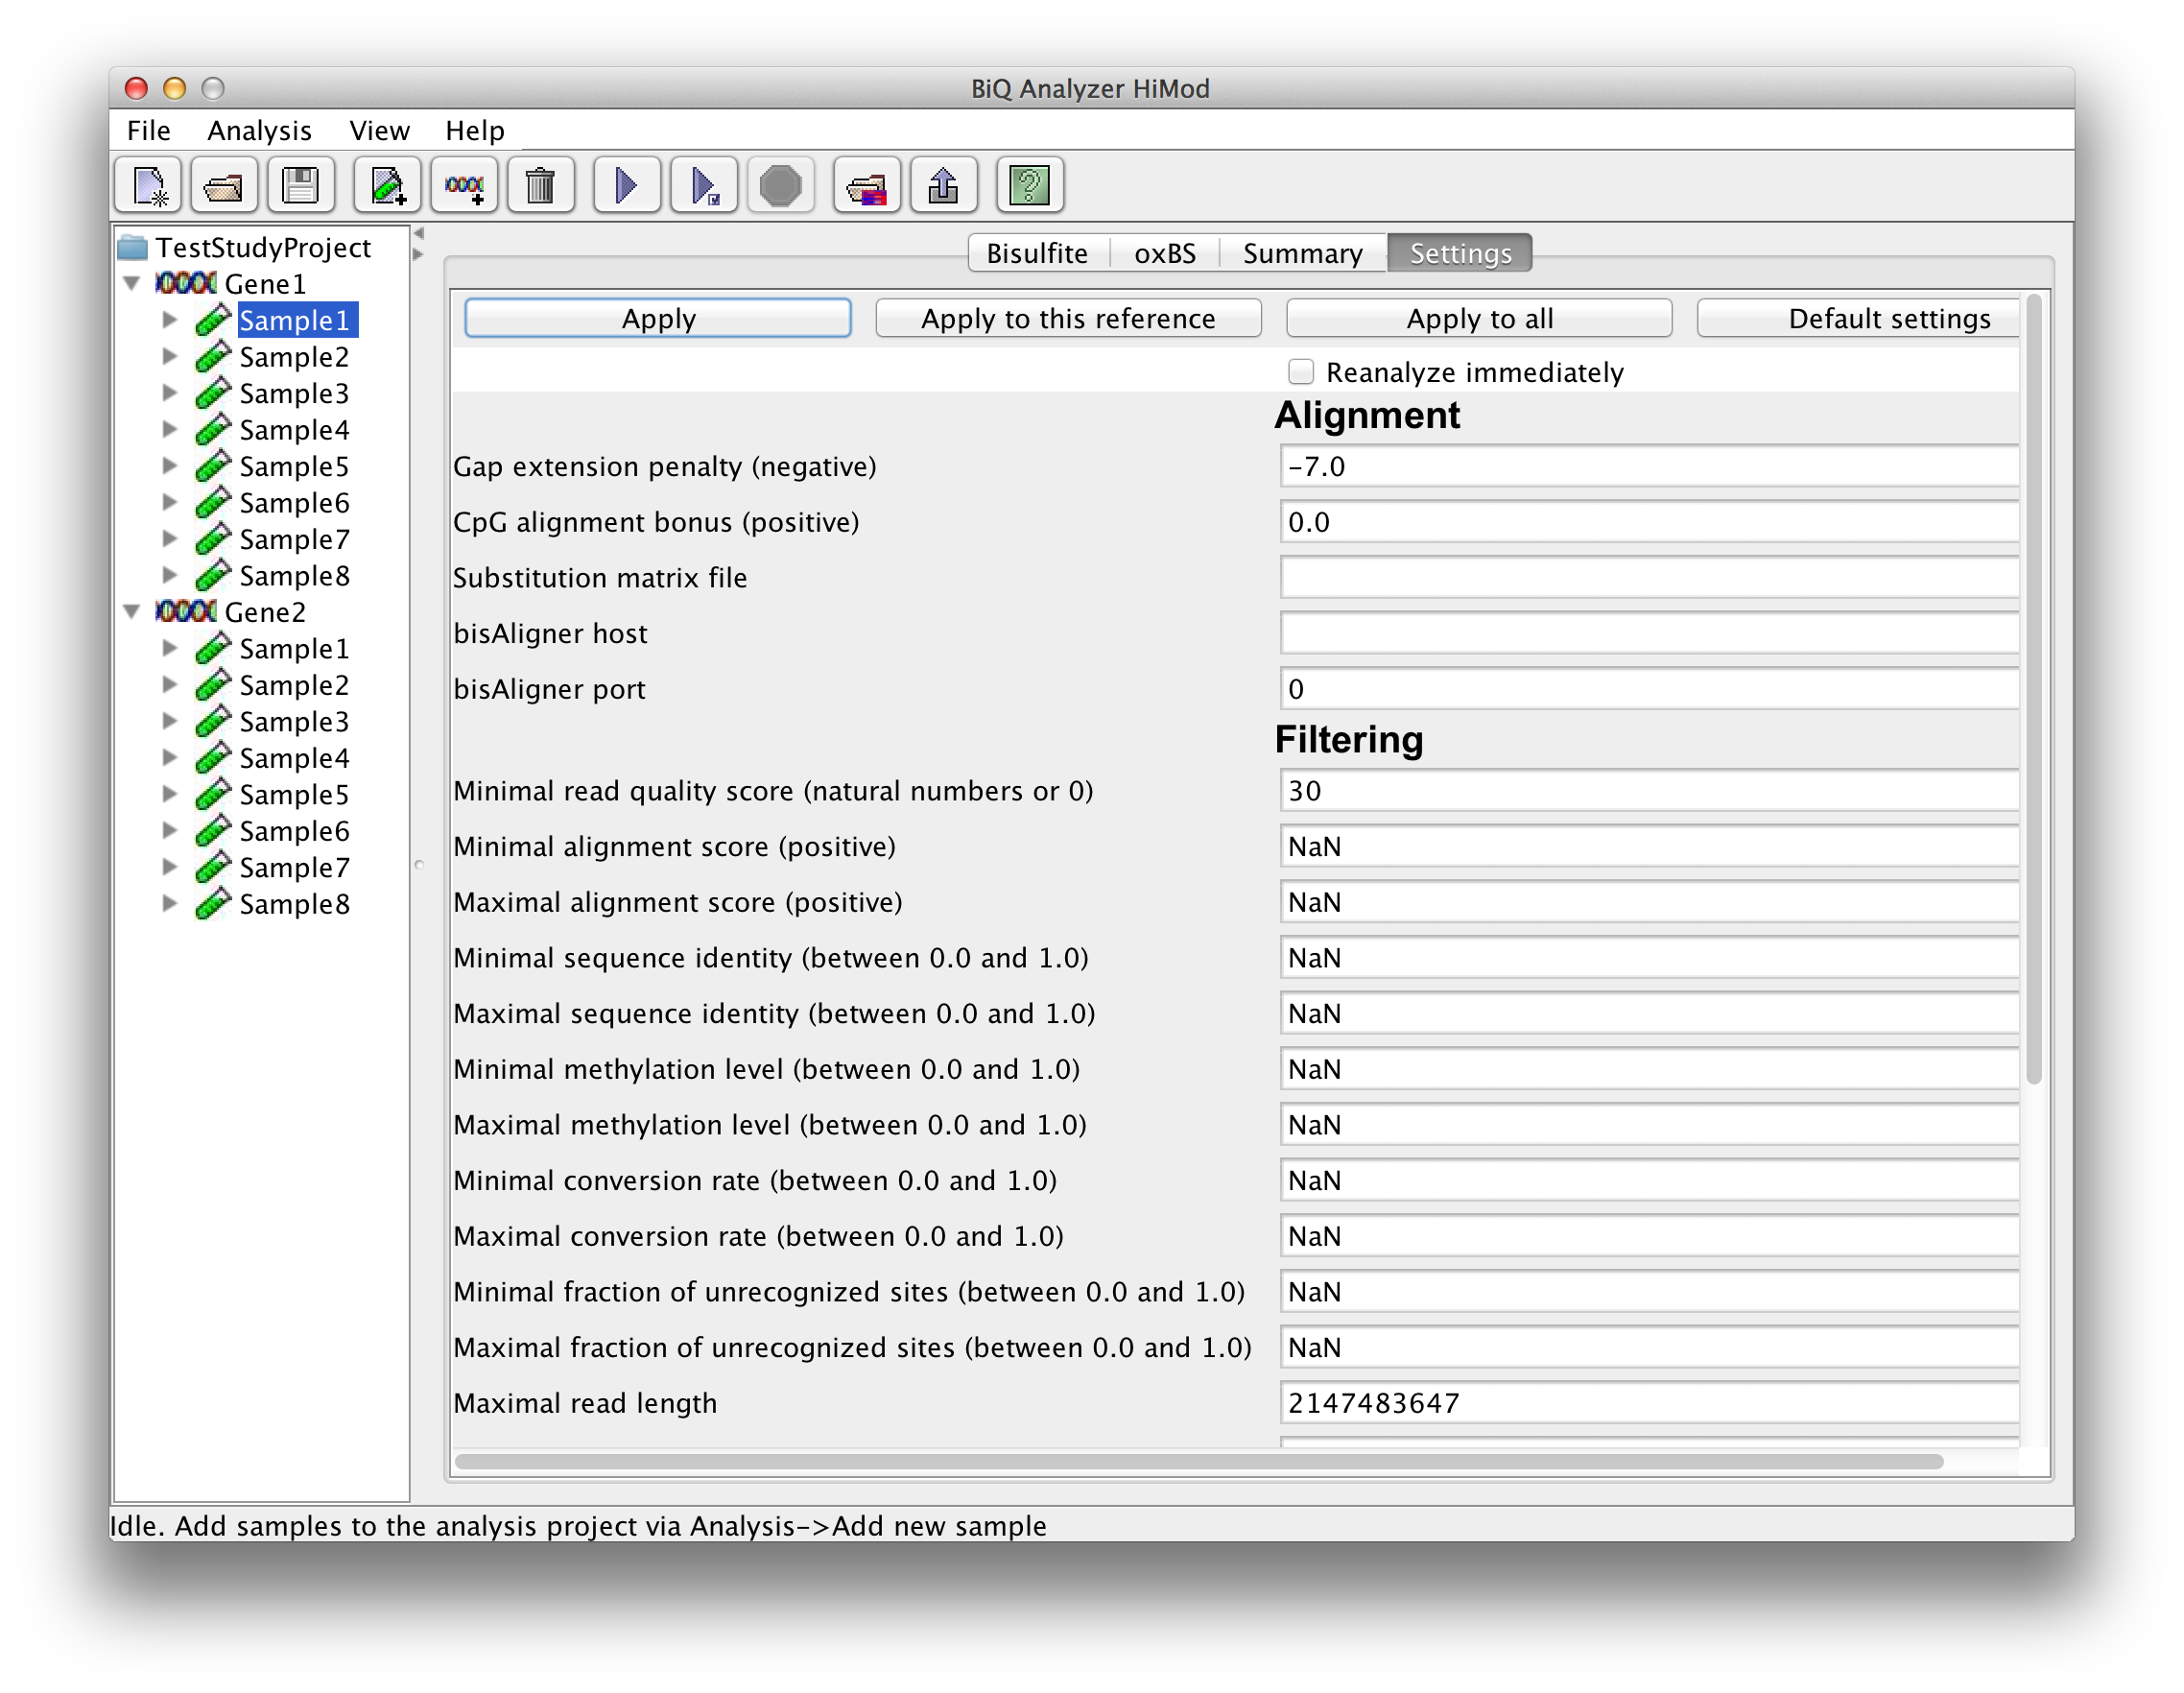
After selecting a leaf in the project tree, a tab with a settings form appears in the BiQ Analyzer main panel. The settings form is divided into four categories – alignment, quality filtering, sorting and output. Alignment parameters include a gap penalty, a bonus for the correct alignment of CpG sites and a custom substitution matrix. The file which corresponds to the default matrix can be downloaded here. The filtering parameters correspond to alignment and bisulfite quality measures (e.g. alignment score, sequence identity, bisulfite conversion rate, sequence length and - in case of Fastq files - sequence quality), as well as to the extracted methylation information (mean methylation level of the read, fraction of unrecognized methylation sites etc.). The set of reads that pass the filtering can be sorted in a number of ways (e.g. by alignment score, sequence identity or methylation level). The output options include keys for generation of various output components. Each setting is supplied with a tool tip giving a detailed explanation. For the quantitative settings the range of acceptable values is also given in the form, next to the label. |
|
 please click on the image to enlarge |
|
|
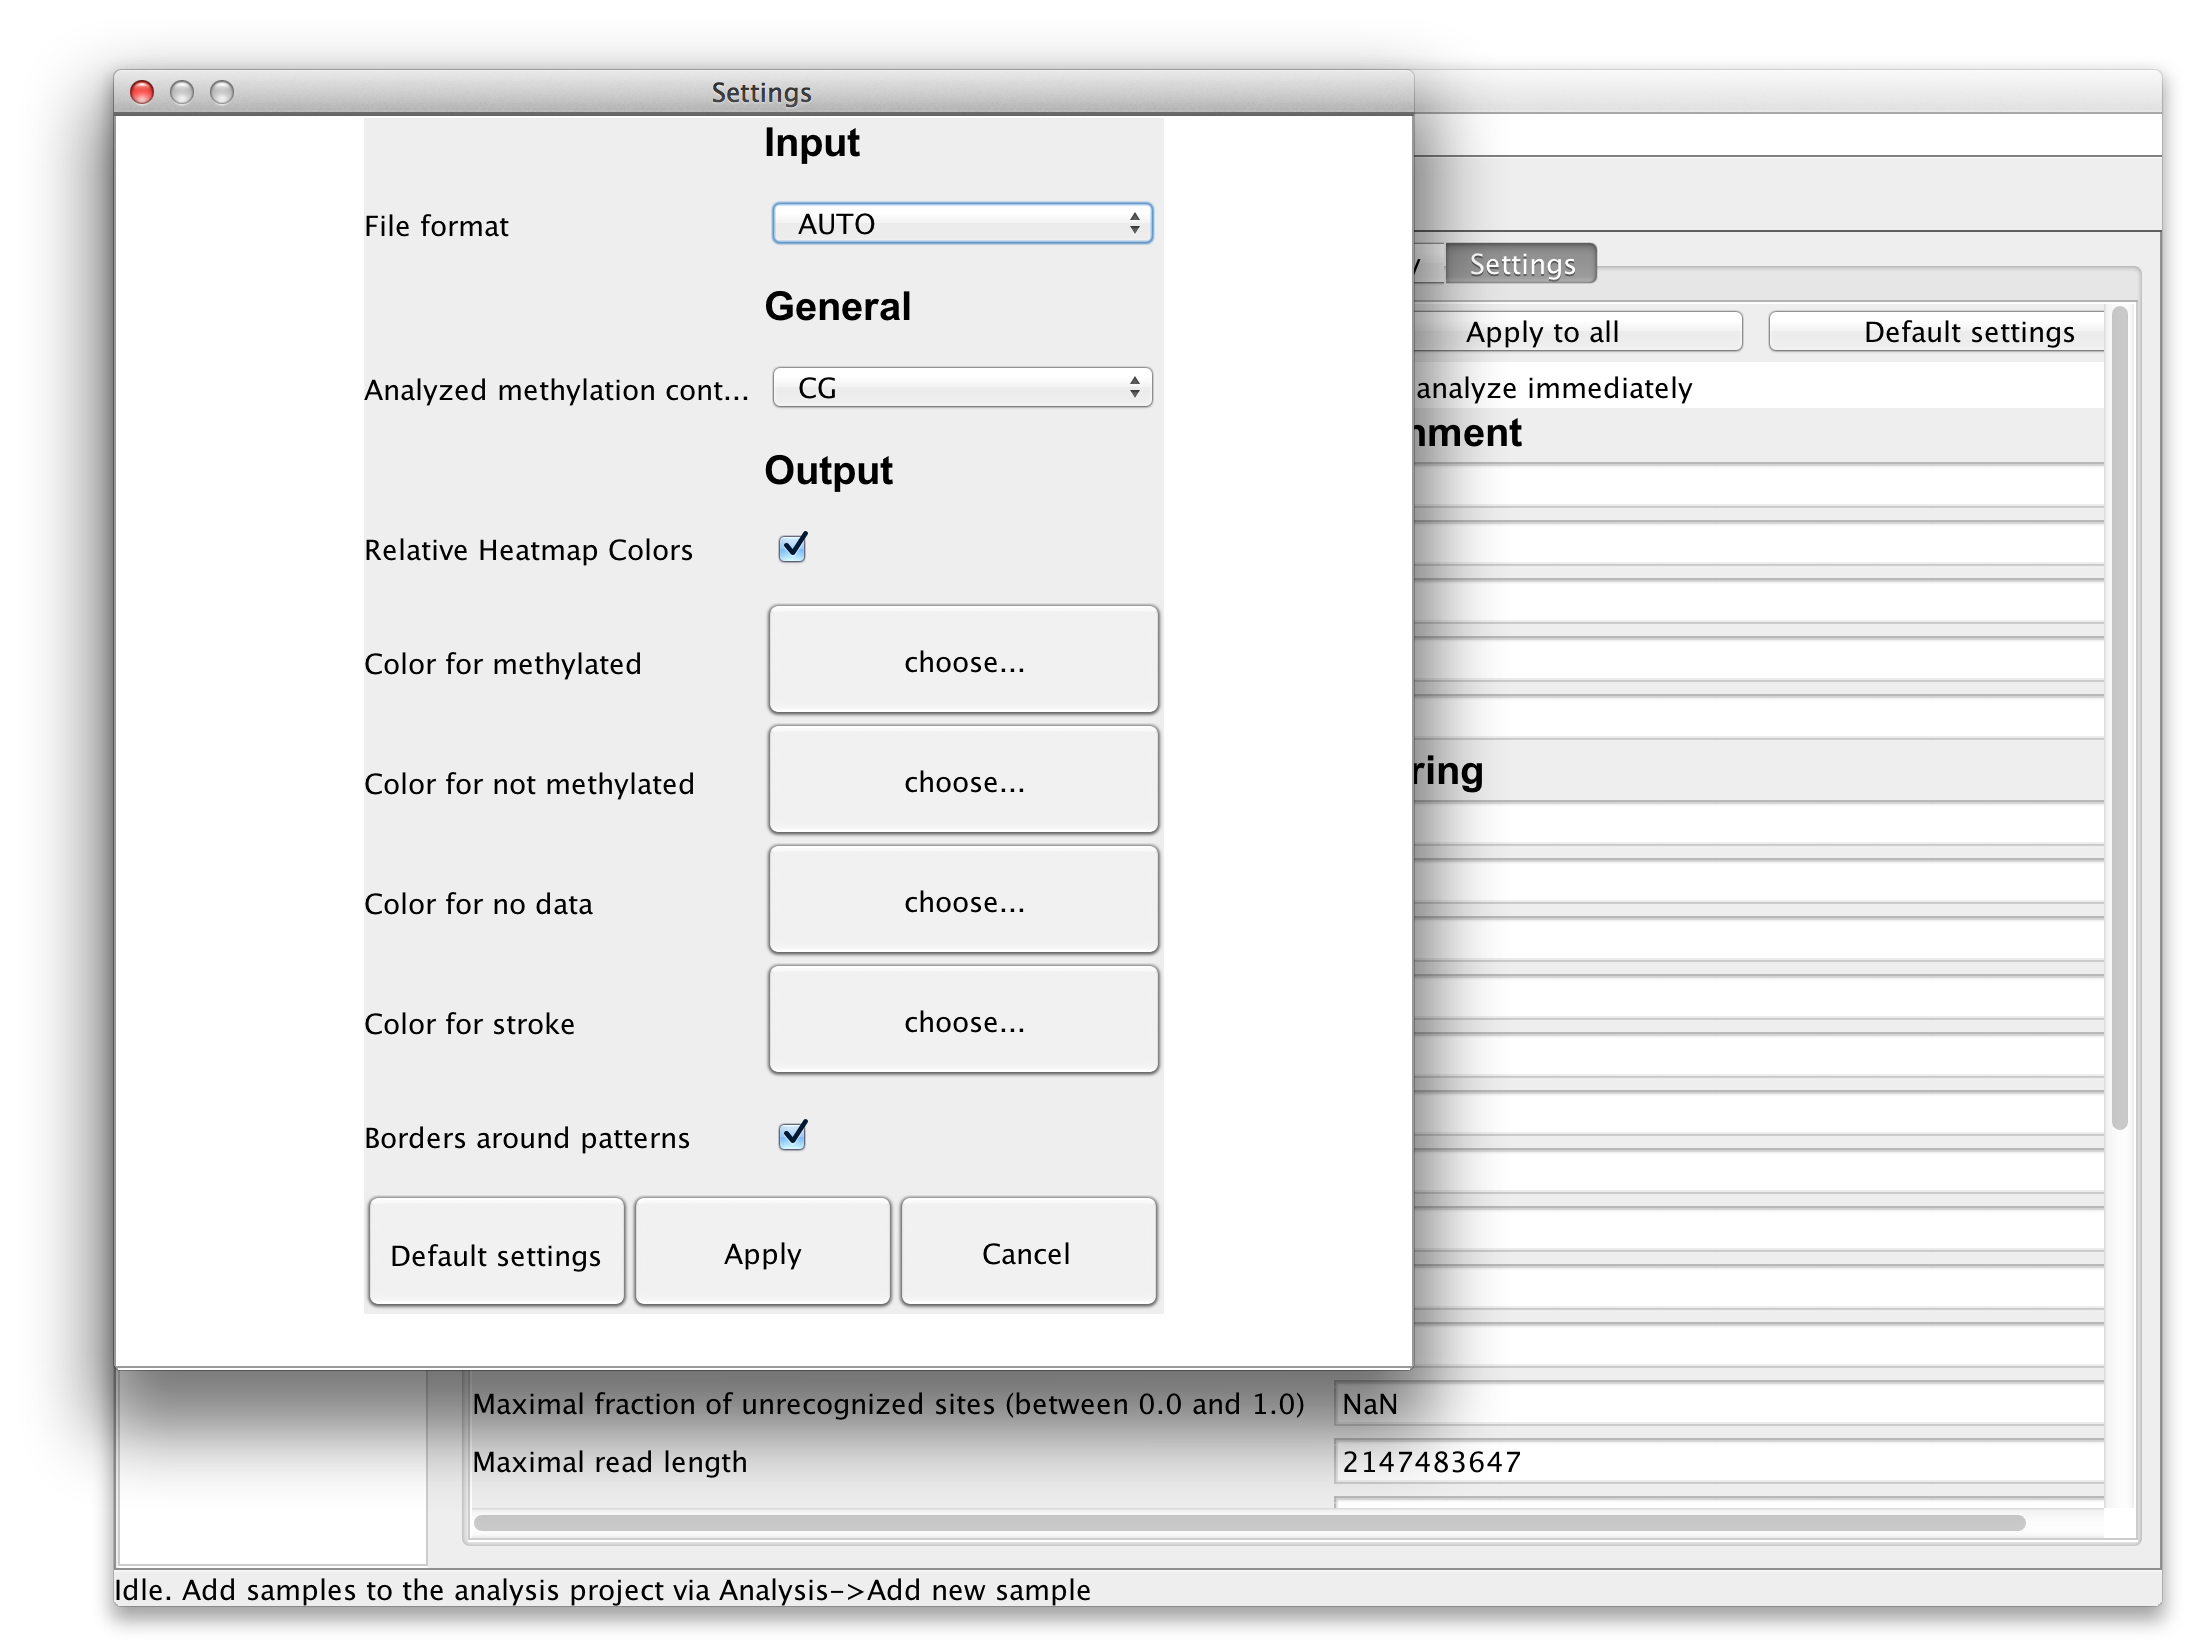
The settings can be applied to the selected read set (by clicking "Apply" button), for all available read sets ("Apply to all") or for all readsets of the selected reference ("Apply to reference"). There are also global settings accessible via "File"->"Settings...". In these global settings one can find options to choose the methylation context and the colors for the diagrams. These settings will be saved locally and loaded each time BiQ Analyzer is started. |
|
 please click on the image to enlarge |
2.3 Running the analysis
|
The processing and analysis of the loaded data can be run for one selected amplicon sample combination or for all combinations. These options are located in the second section of the "Analysis" menu. The notifications about the current activity of the tool will appear in the status pane on the bottom. As soon as the analysis is finished the main application panel will be updated and the results of the analysis will be loaded. A running analysis can be stopped at any moment via "Analysis"->"Terminate". |
2.4 Inspecting the results
|
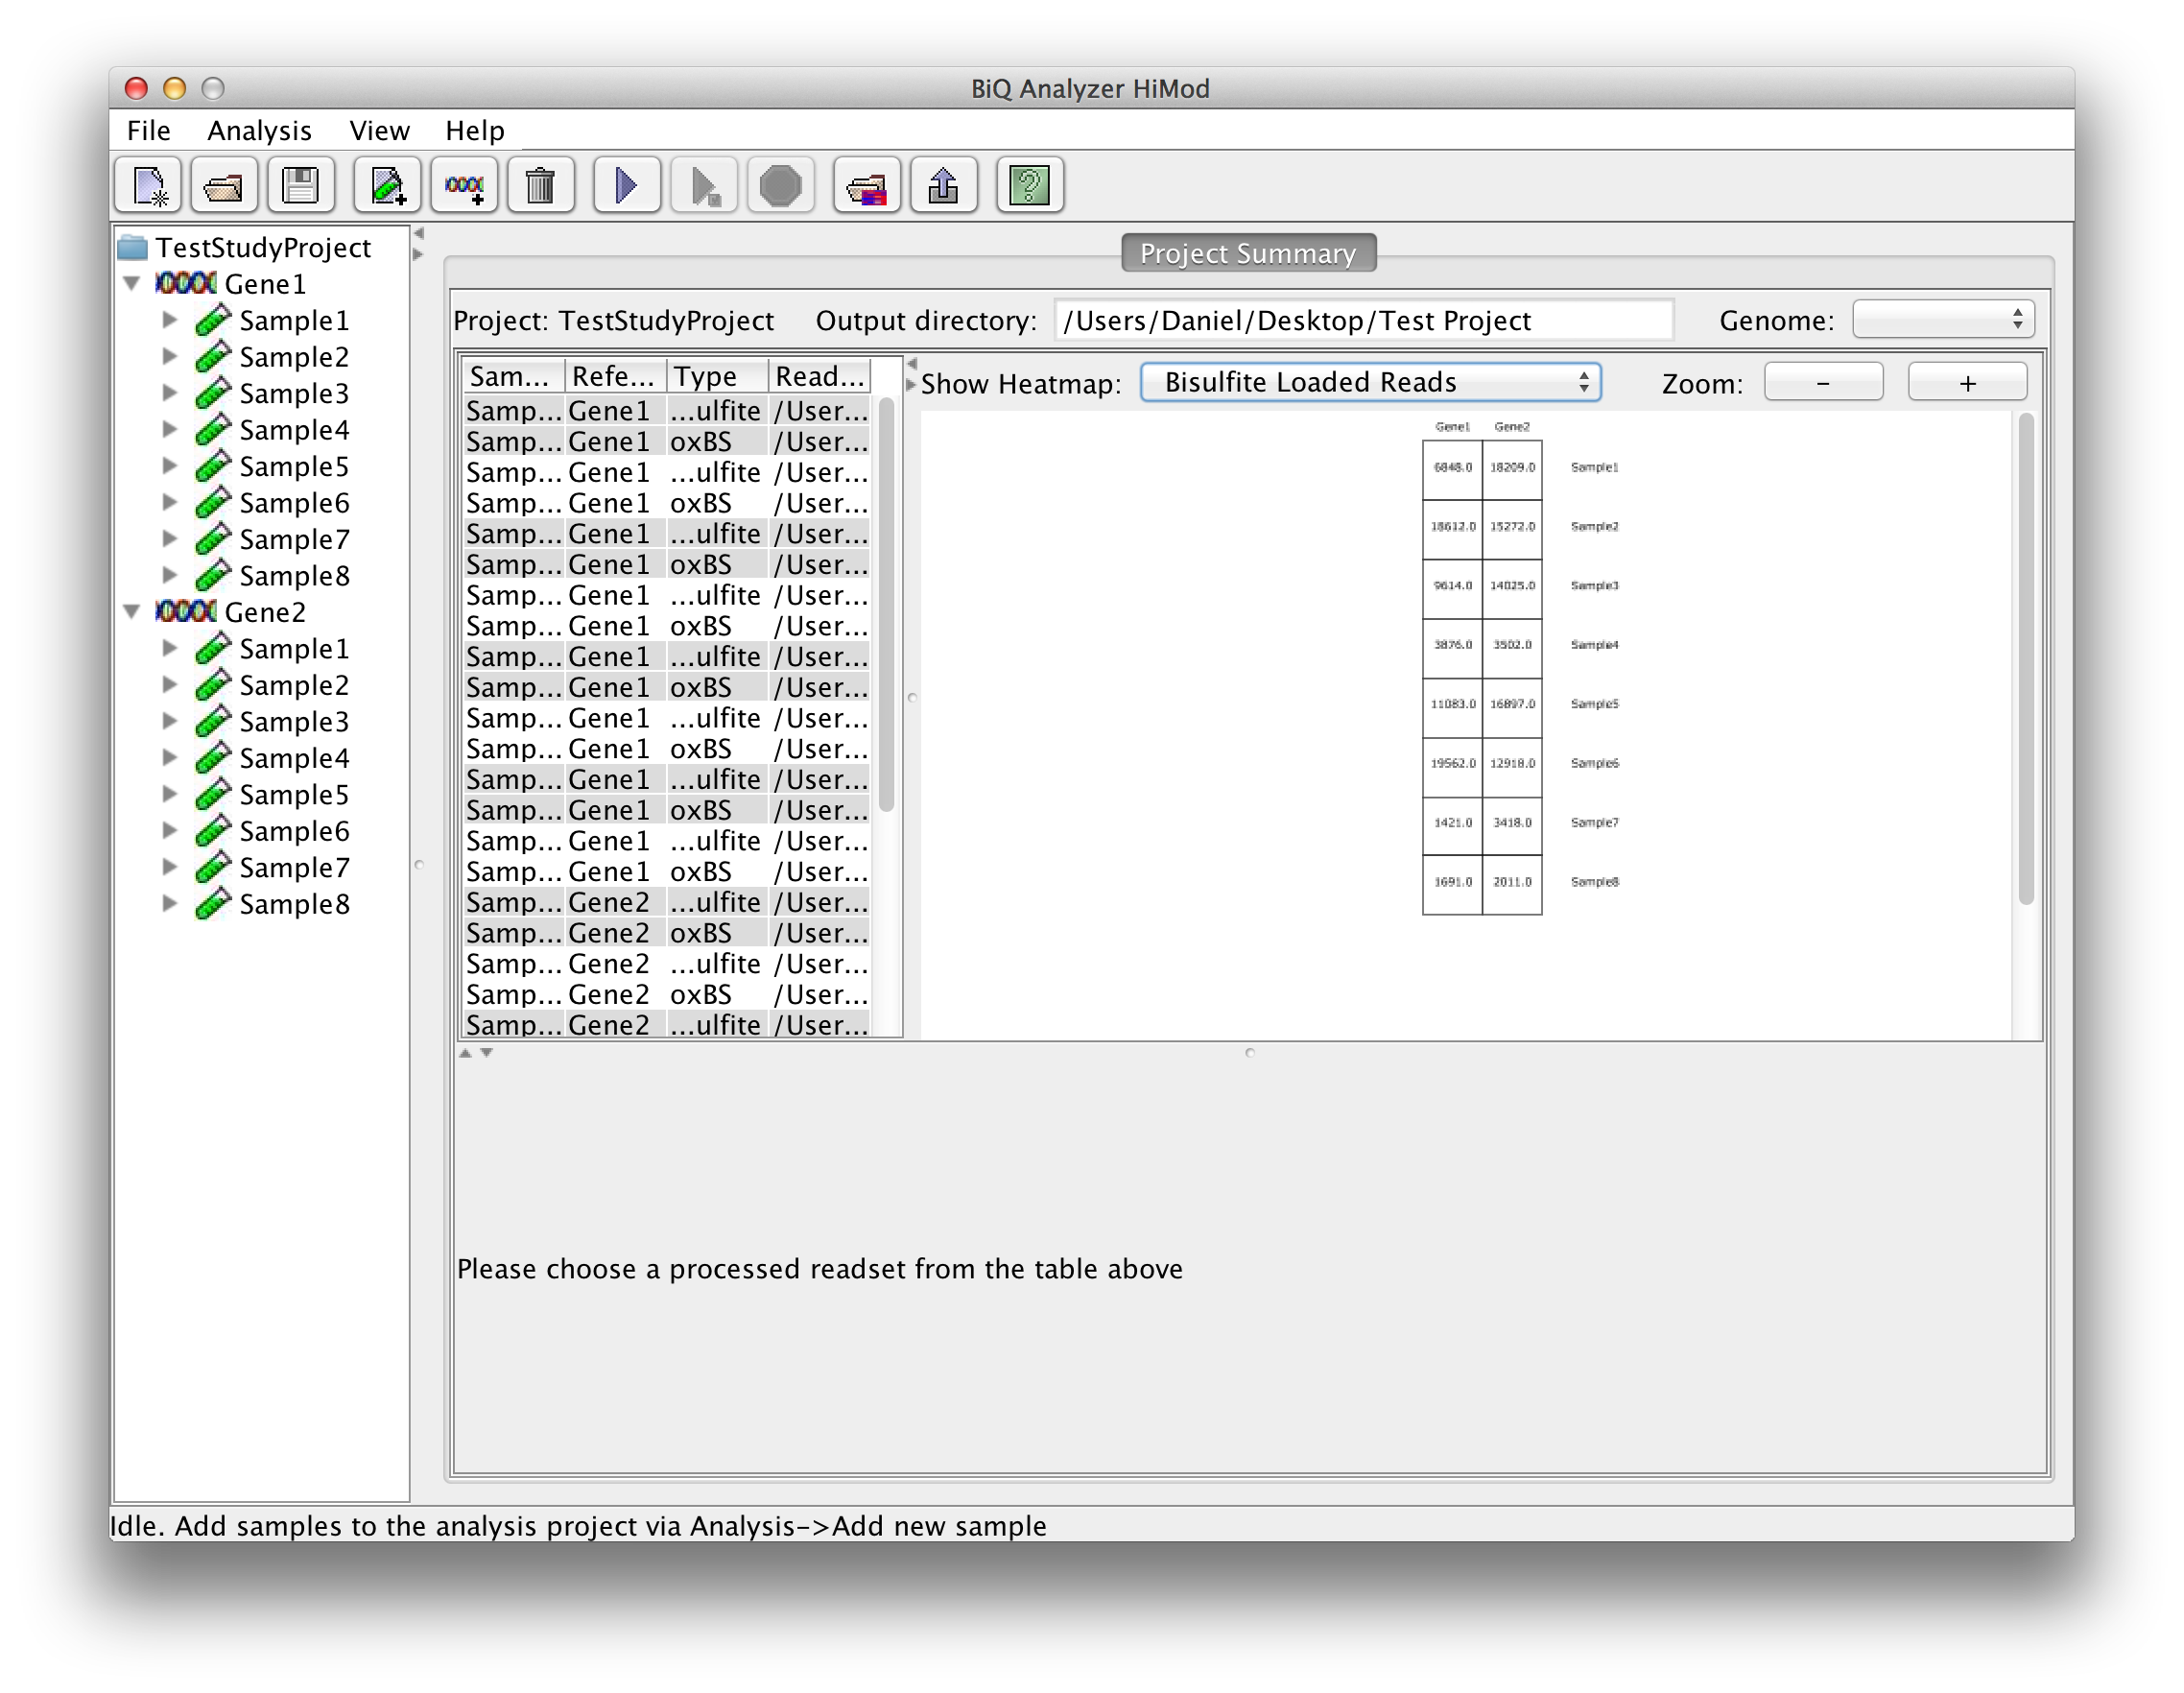
The BiQ Analyzer backend processes the loaded data and outputs DNA methylation information to the project output folder in several forms. First of all the results of the analysis are reflected in the project summary. Information about processed read sets, e.g. the read counts, basic DNA methylation and bisulfite quality statistics, is written to the summary table, and the mean methylation values are used to update the corresponding cells of the zoomable project methylation heatmaps. In case of a project with two readsets per amplicon per sample the user can choose between a heatmap for each of the sequencing types as well as a difference heatmap. | |
 please click on the image to enlarge |
|
|
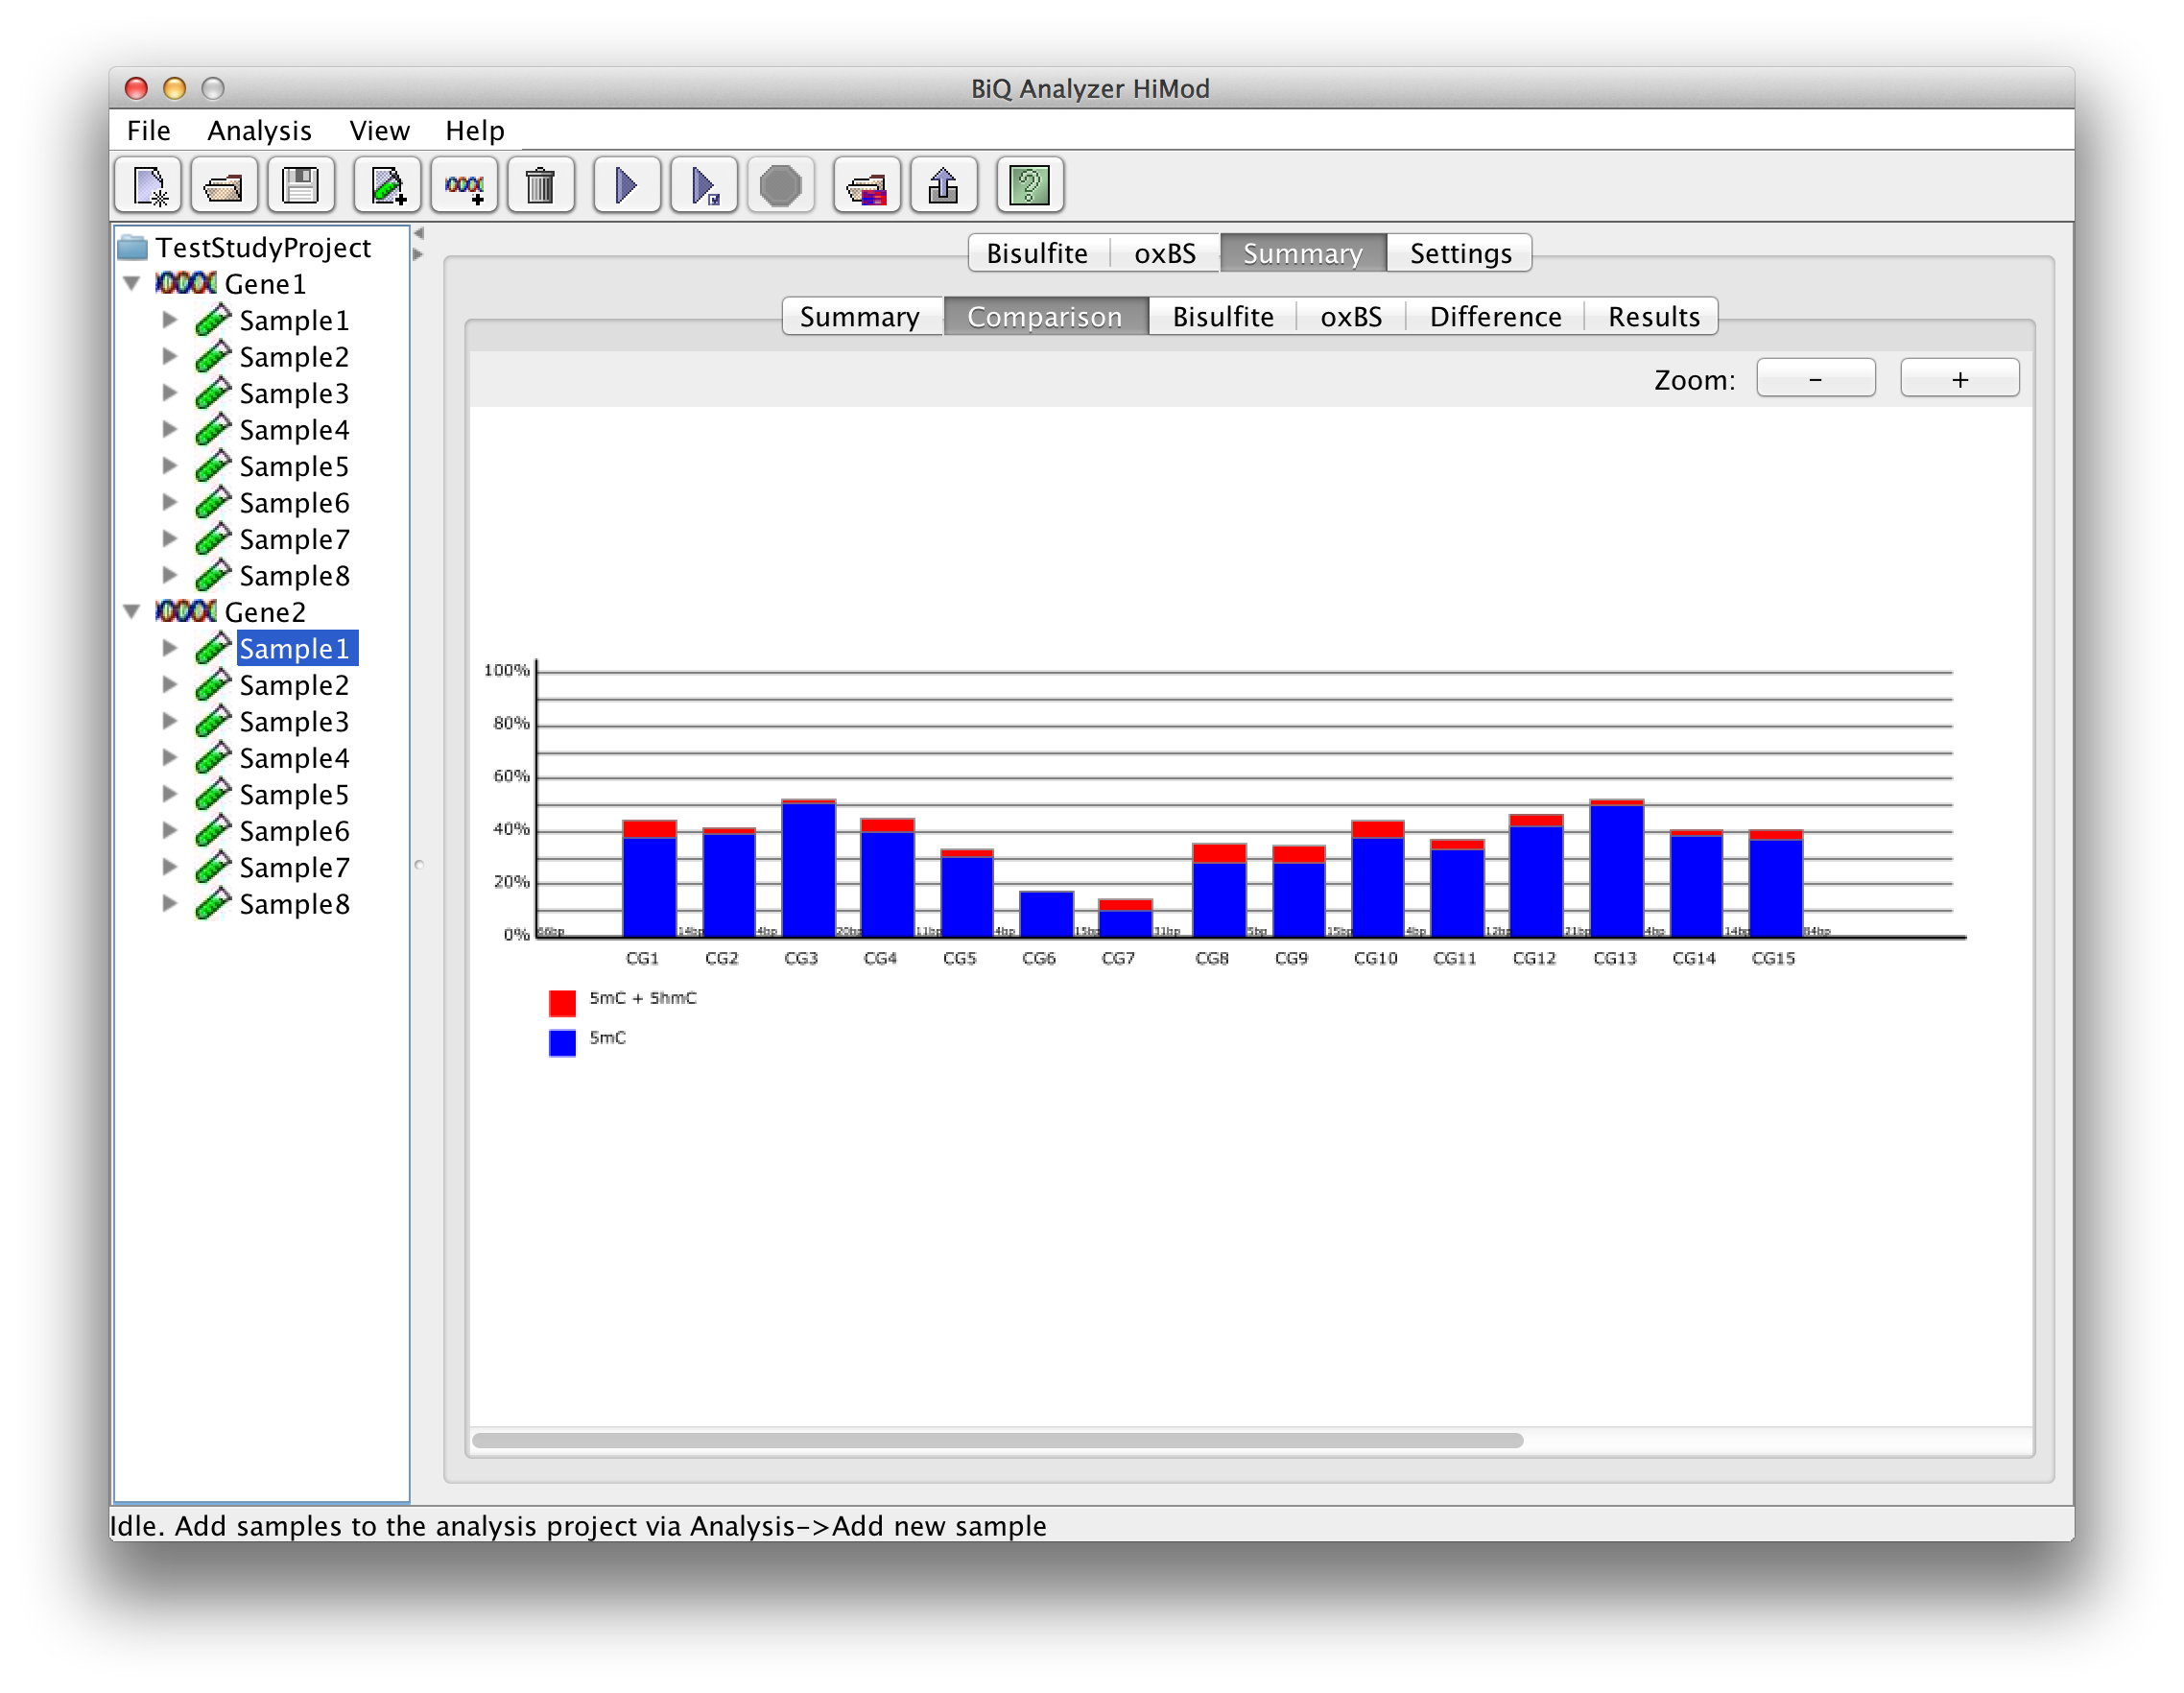
By choosing a row in the project summary table the user can display a zoomable bar diagrams for the specified readset. Using the drop down menu it is possible to choose further between a bar diagram for each of the sequence types, a difference and a comparison bar diagram. |
|
 please click on the image to enlarge |
|
|
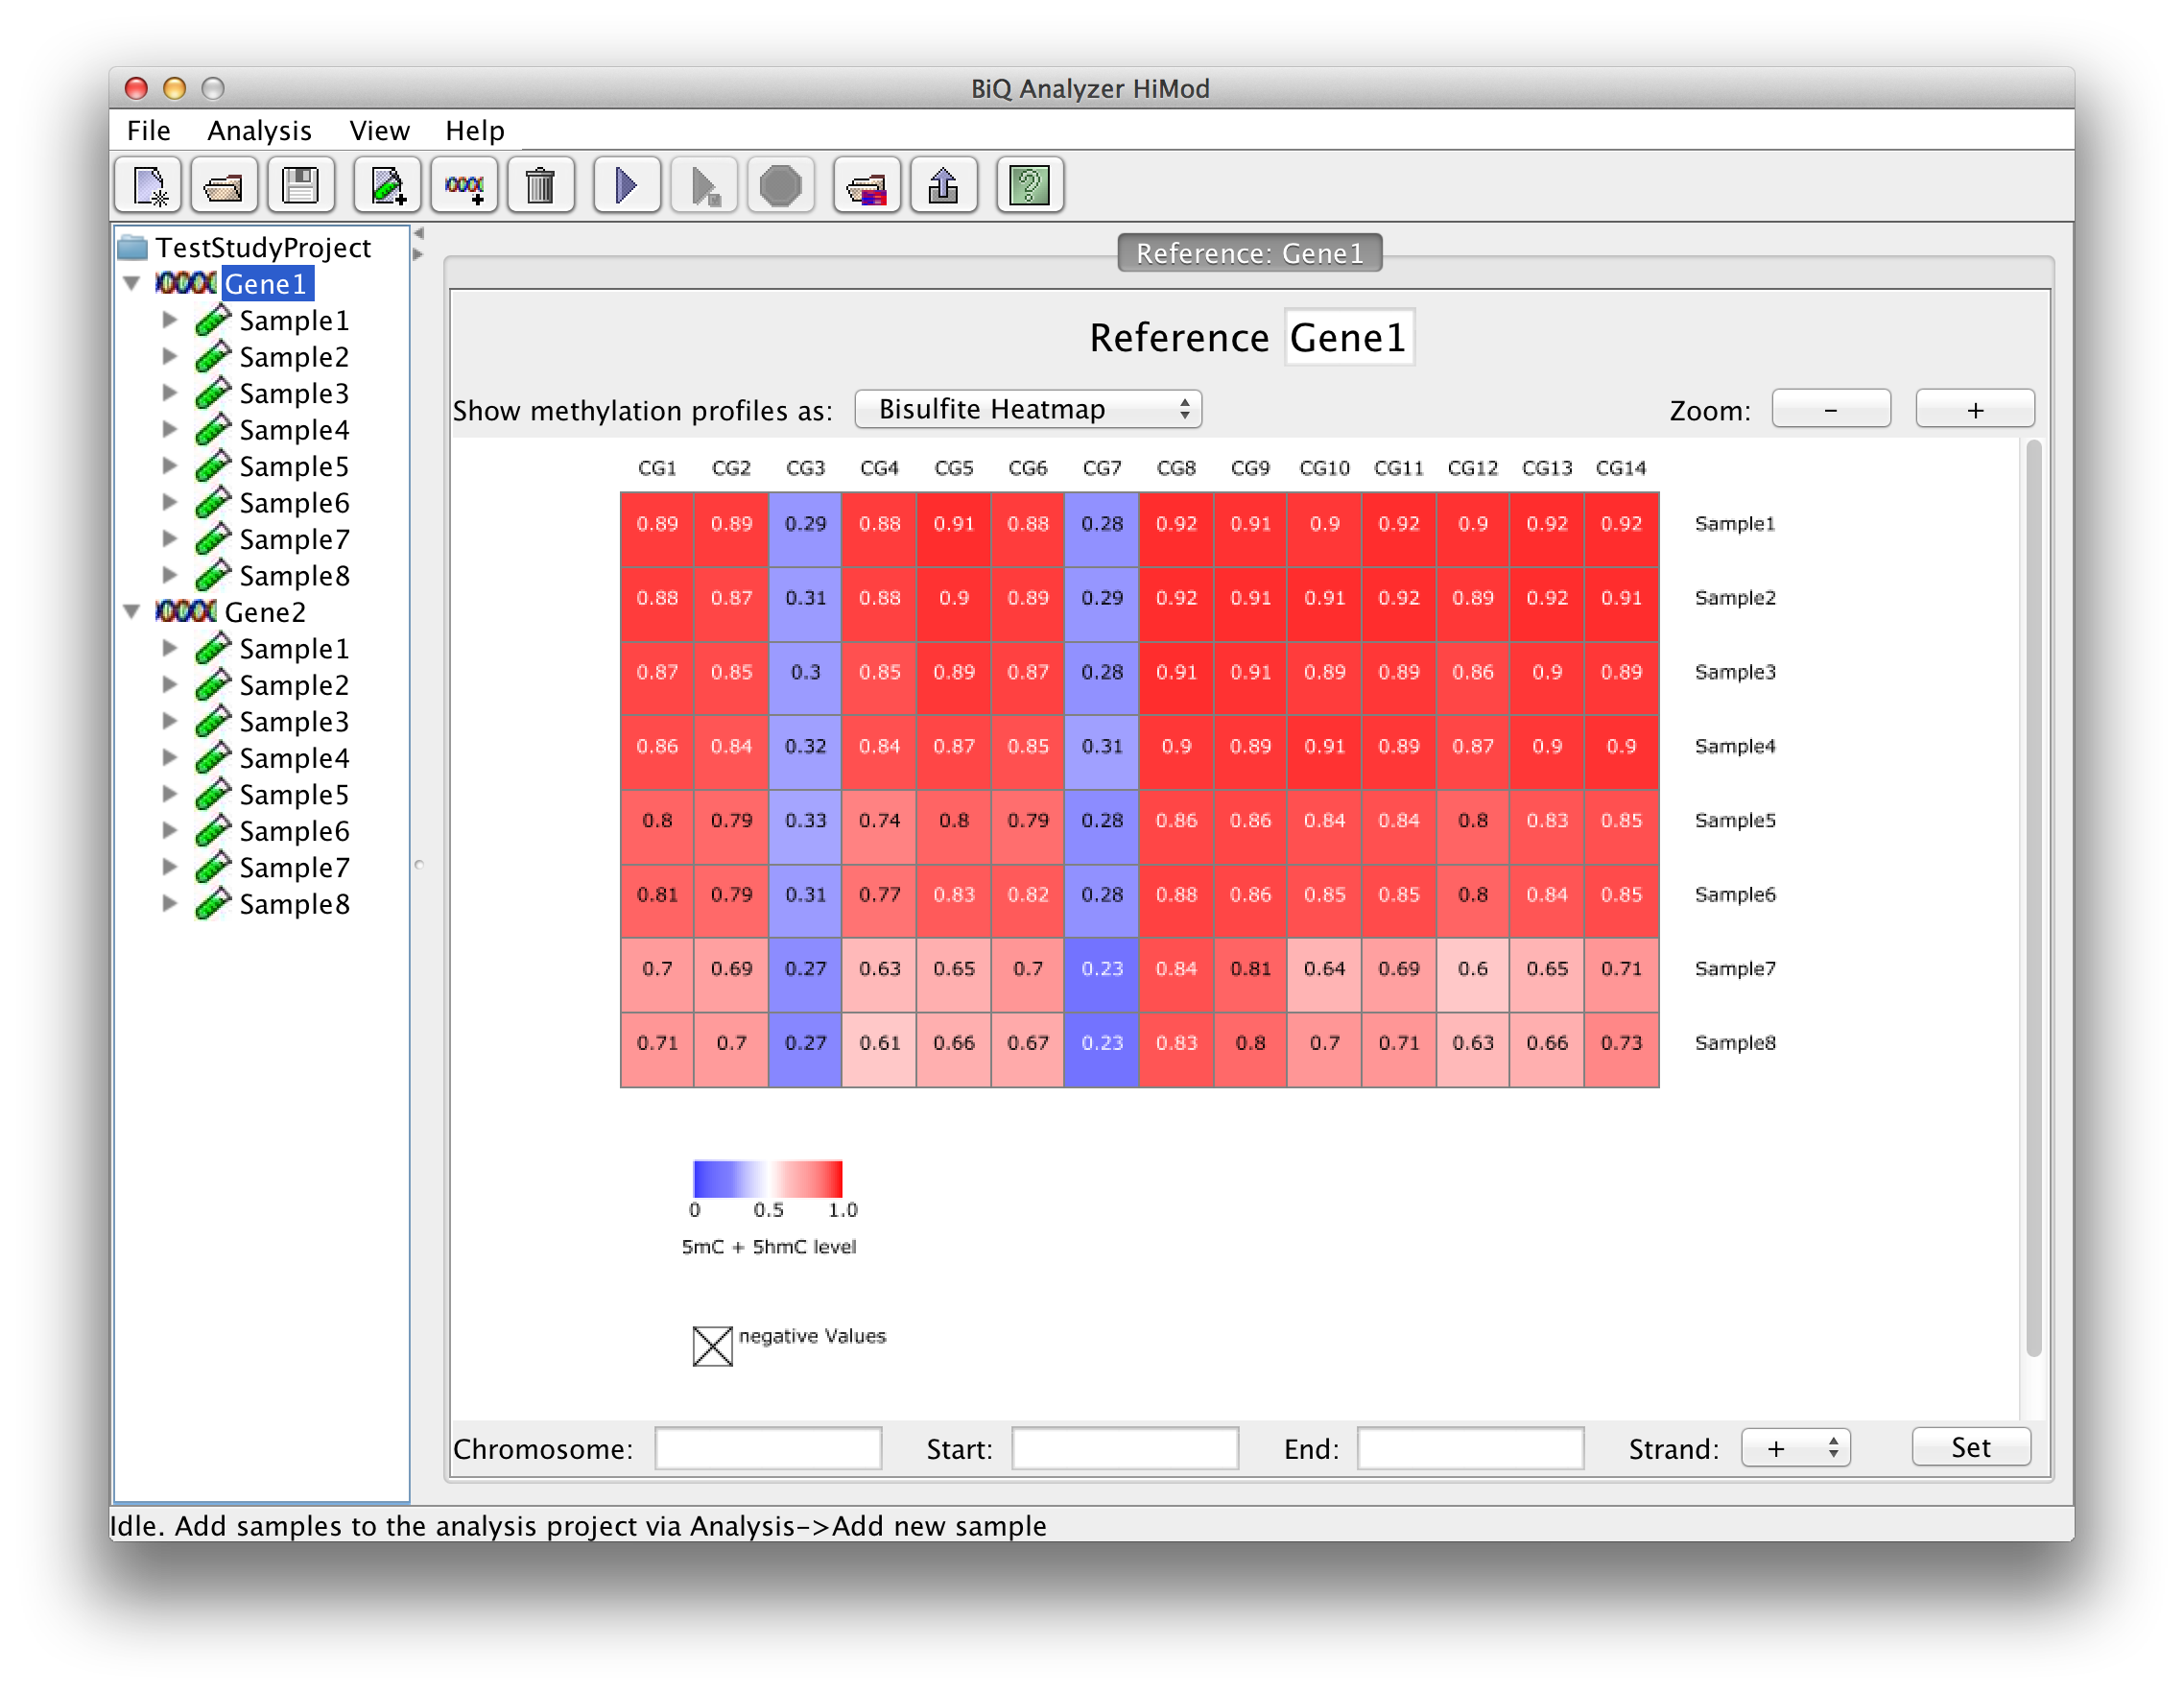
The summary statistics are also available for each analyzed sample - as a summarizing table - and reference sequence - as zoomable heatmaps of averaged methylation profiles. The user can choose here as well between the tree types of heatmap in case the analysis consists of two readsets per amplicon per sample. |
|
 please click on the image to enlarge |
|
|
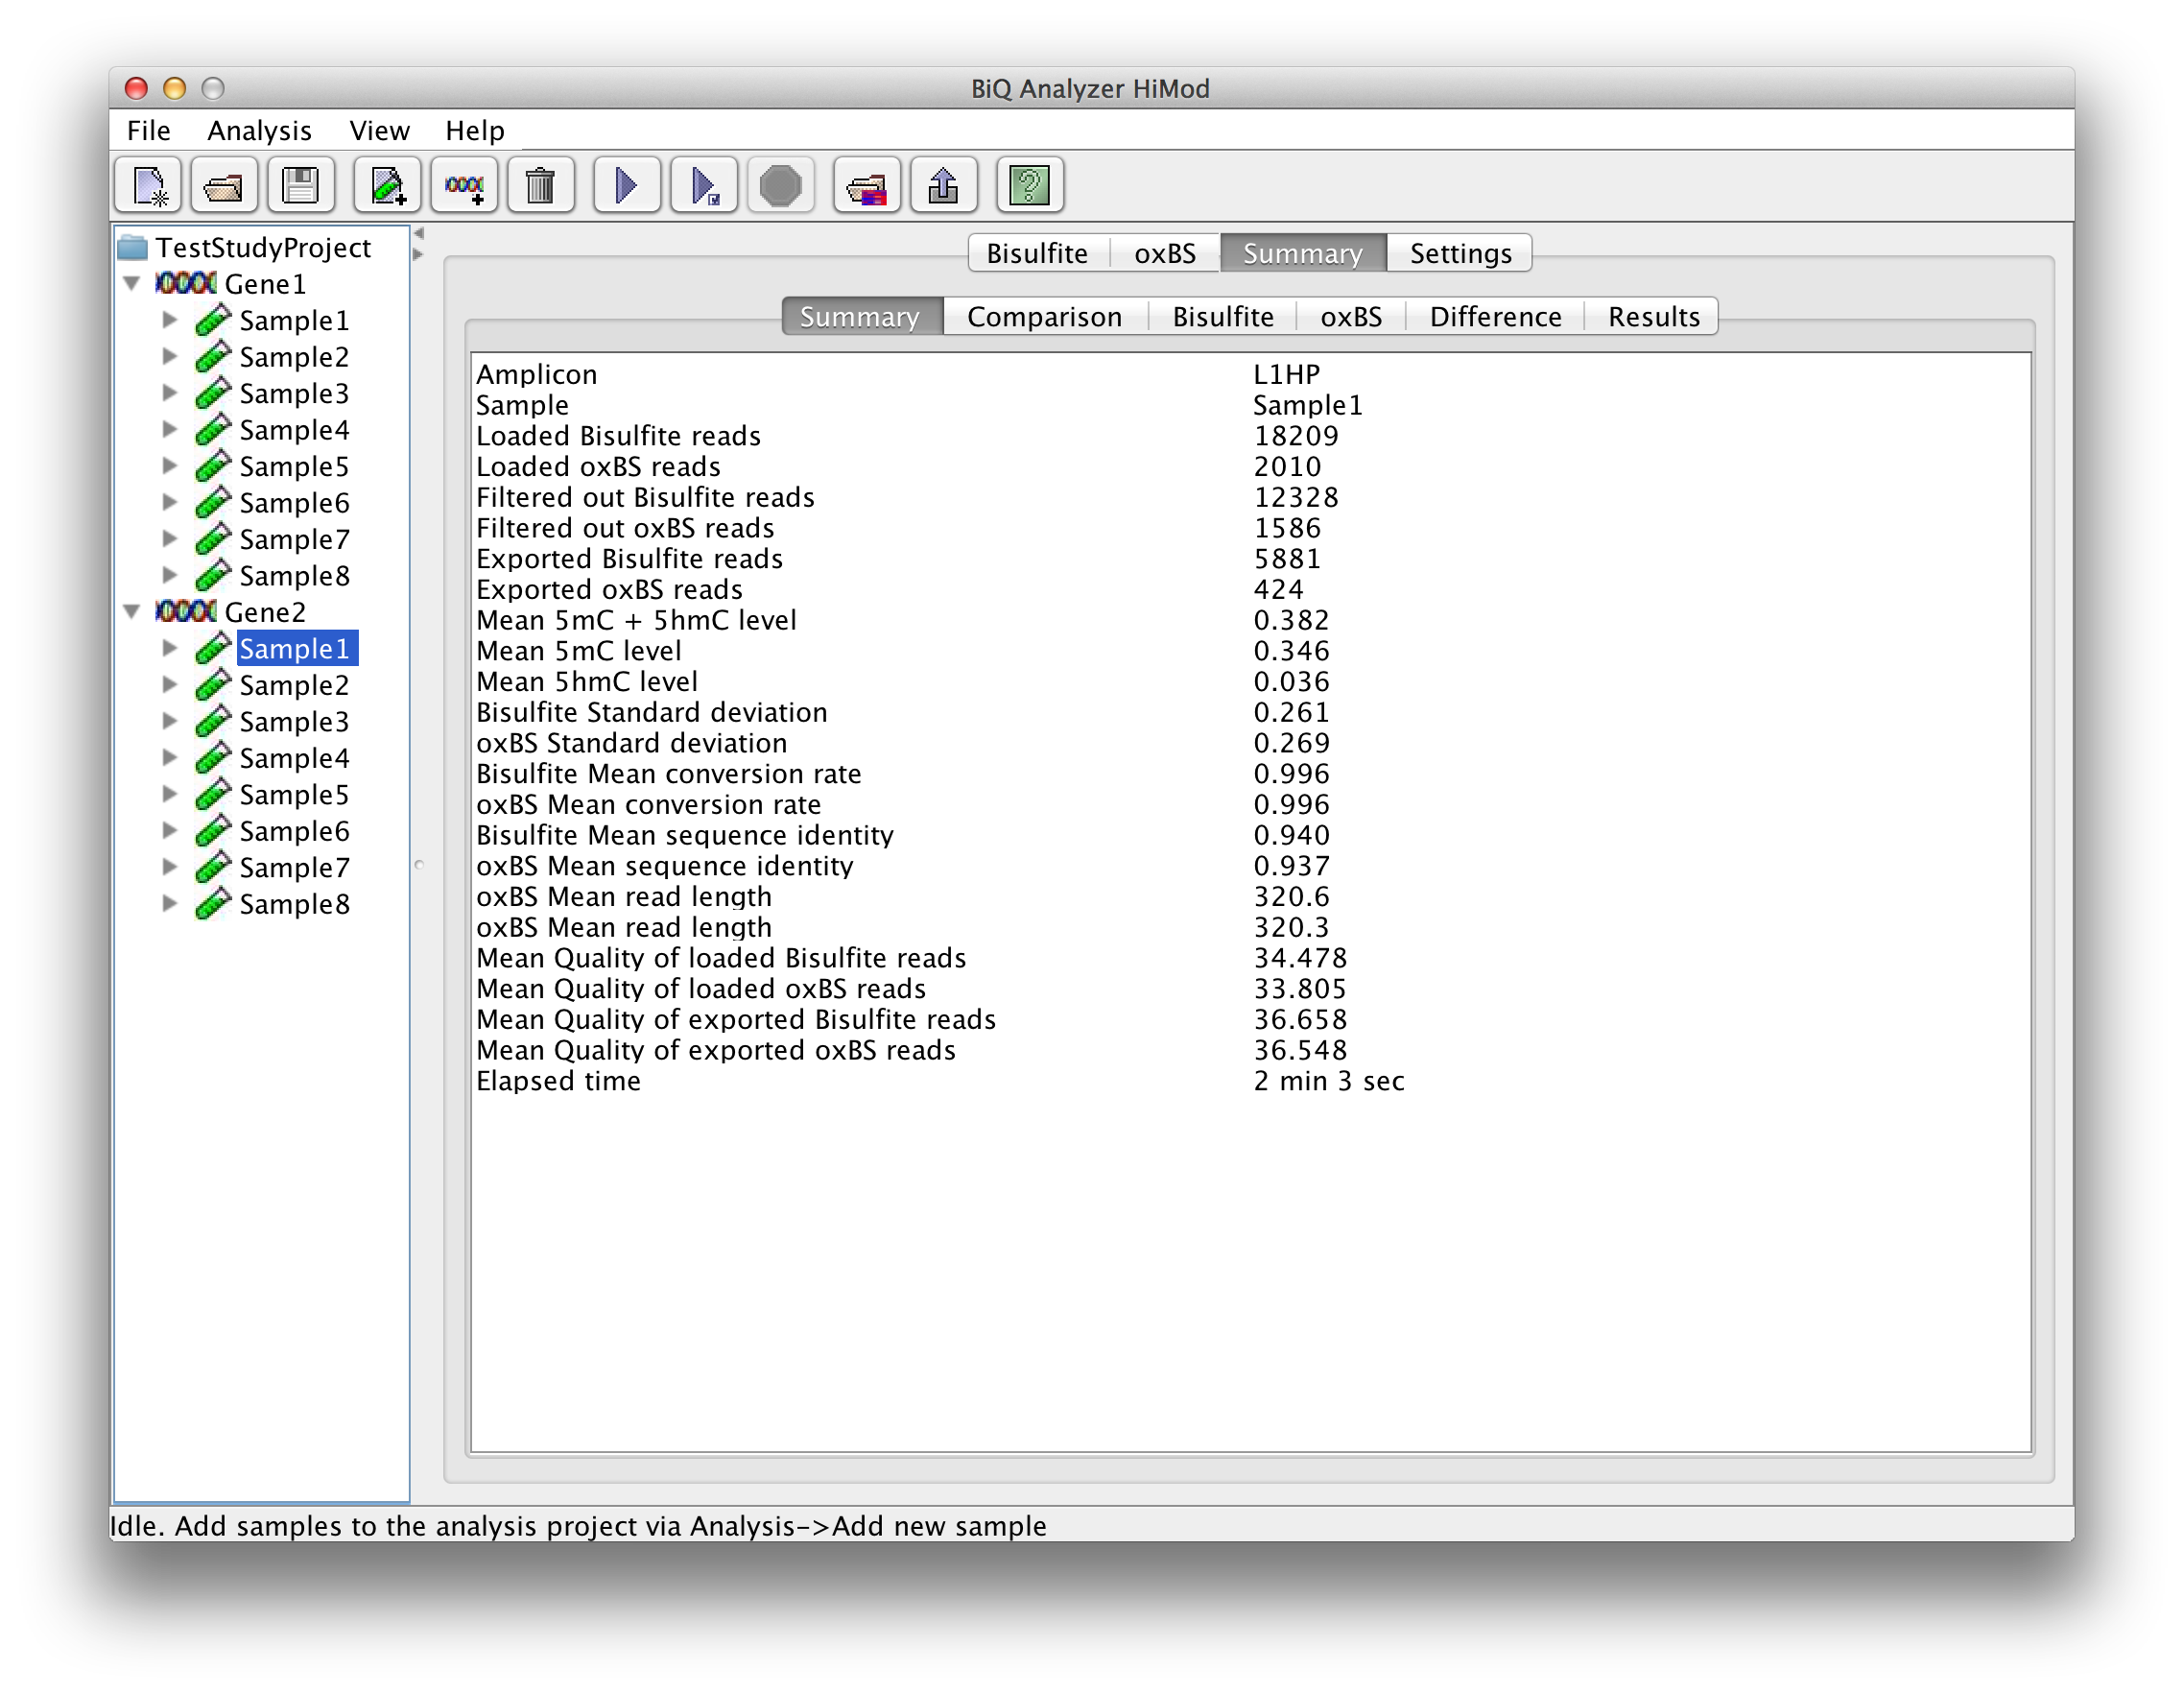
For each analyzed sample-reference combination a number of result tabs are added to the main application panel. The "Summary" tab gives short information about the run including mean methylation level calculated for the amplicon and elapsed analysis time. |
|
 please click on the image to enlarge |
|
|
In case of a project with two readsets per amplicon per sample there are further subordinate tabs which show the four bar diagrams known from the project summary. |
|
 please click on the image to enlarge |
|
|
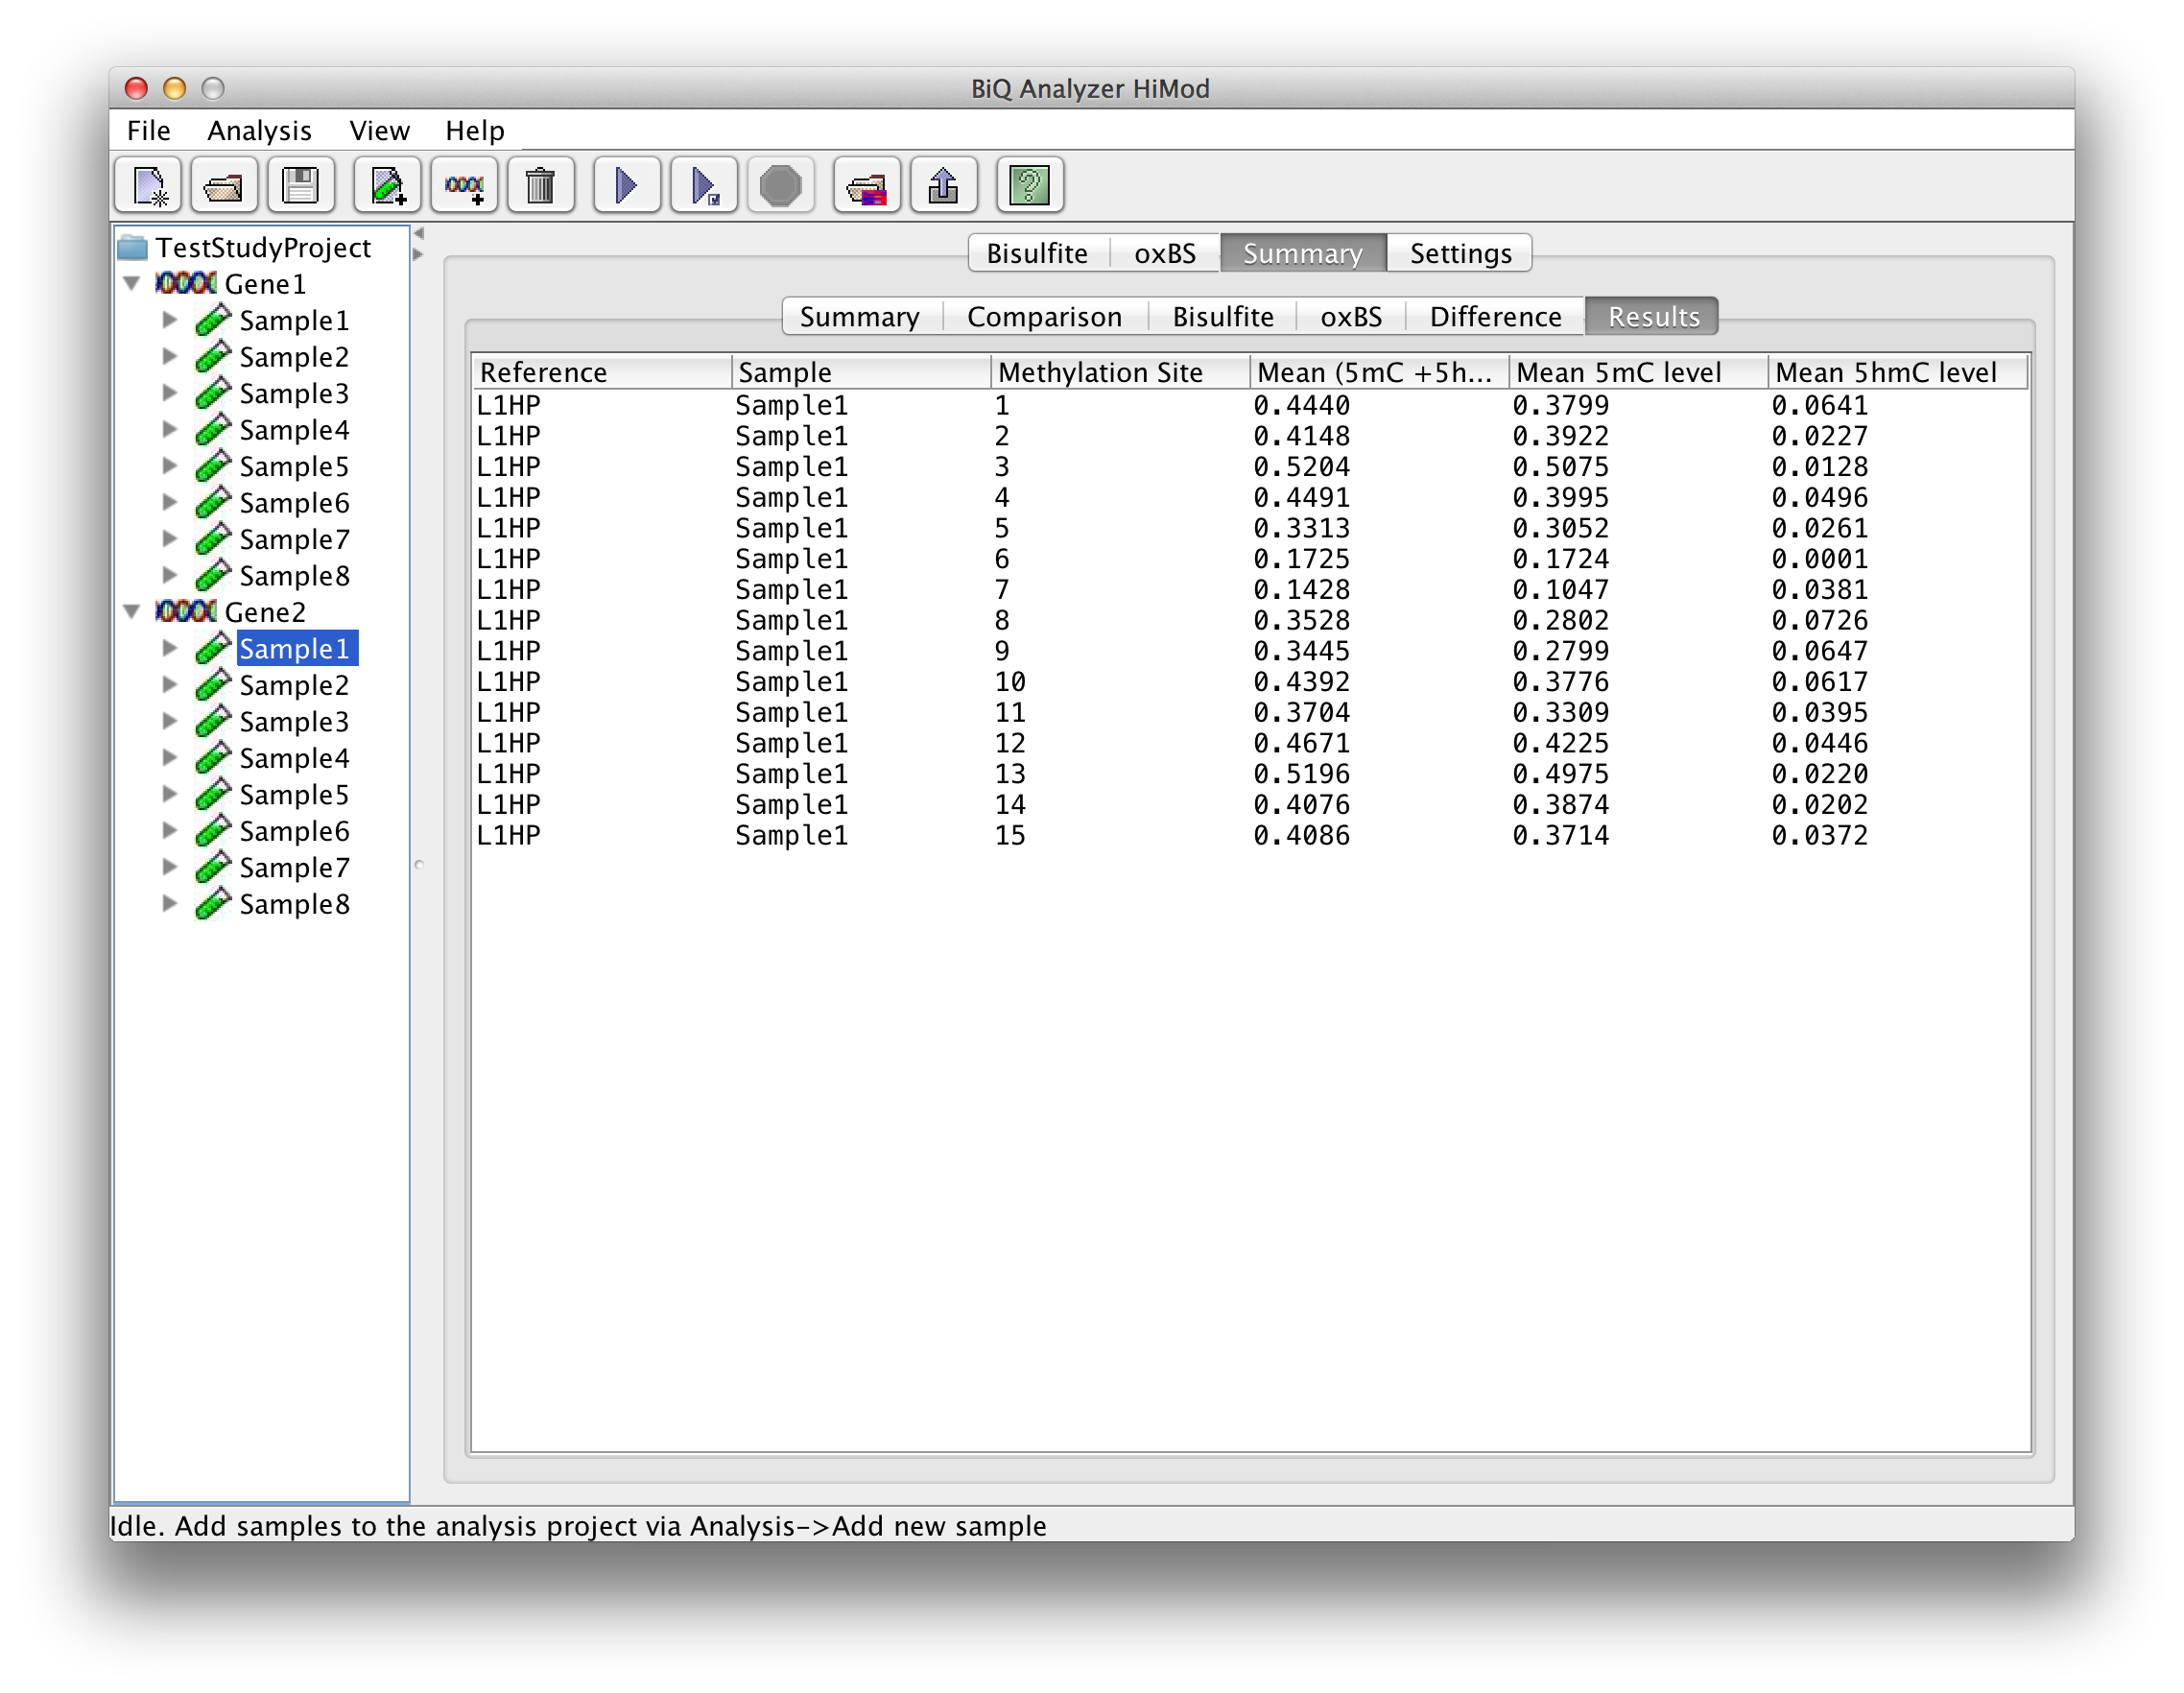
The "Results" tab gives a table with analysis information for each methylation site. |
|
 please click on the image to enlarge |
|
|
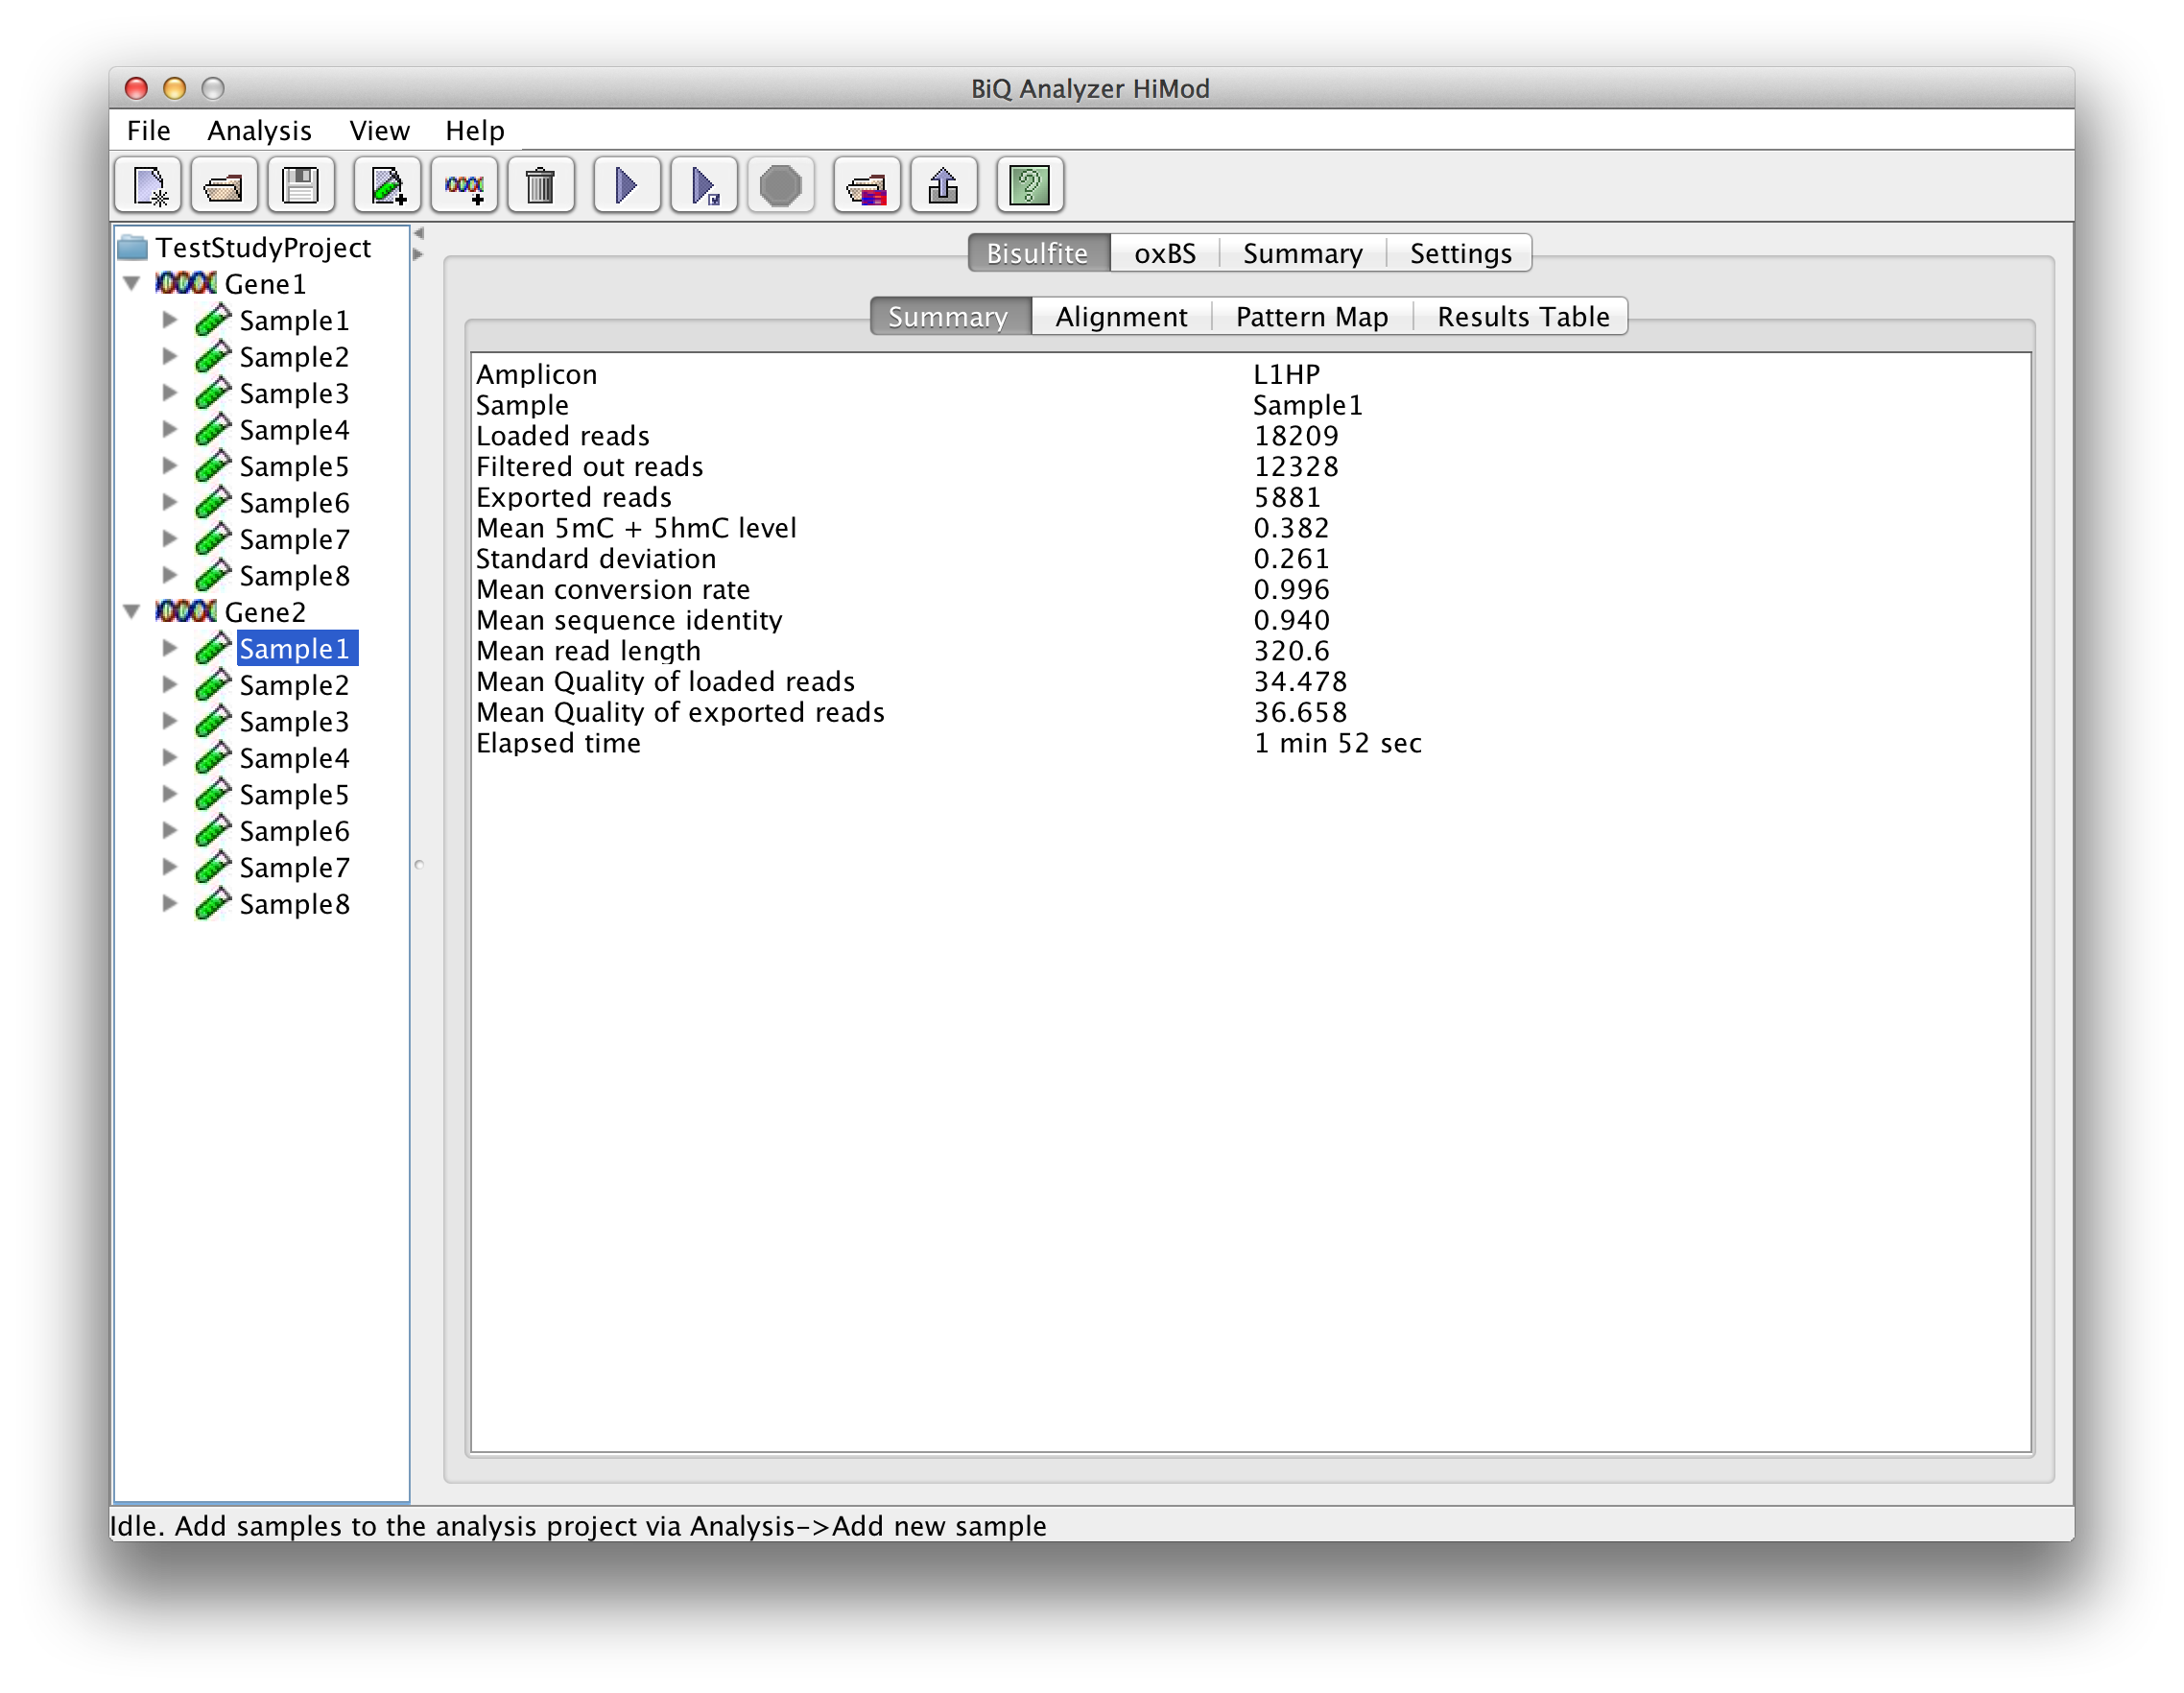
For each sequencing type there is another superior tab with four subordinate tabs. The "Summary" tab gives short information about the run for the reads of this sequencing type including mean methylation level calculated for the amplicon and elapsed analysis time. |
|
 please click on the image to enlarge |
|
|
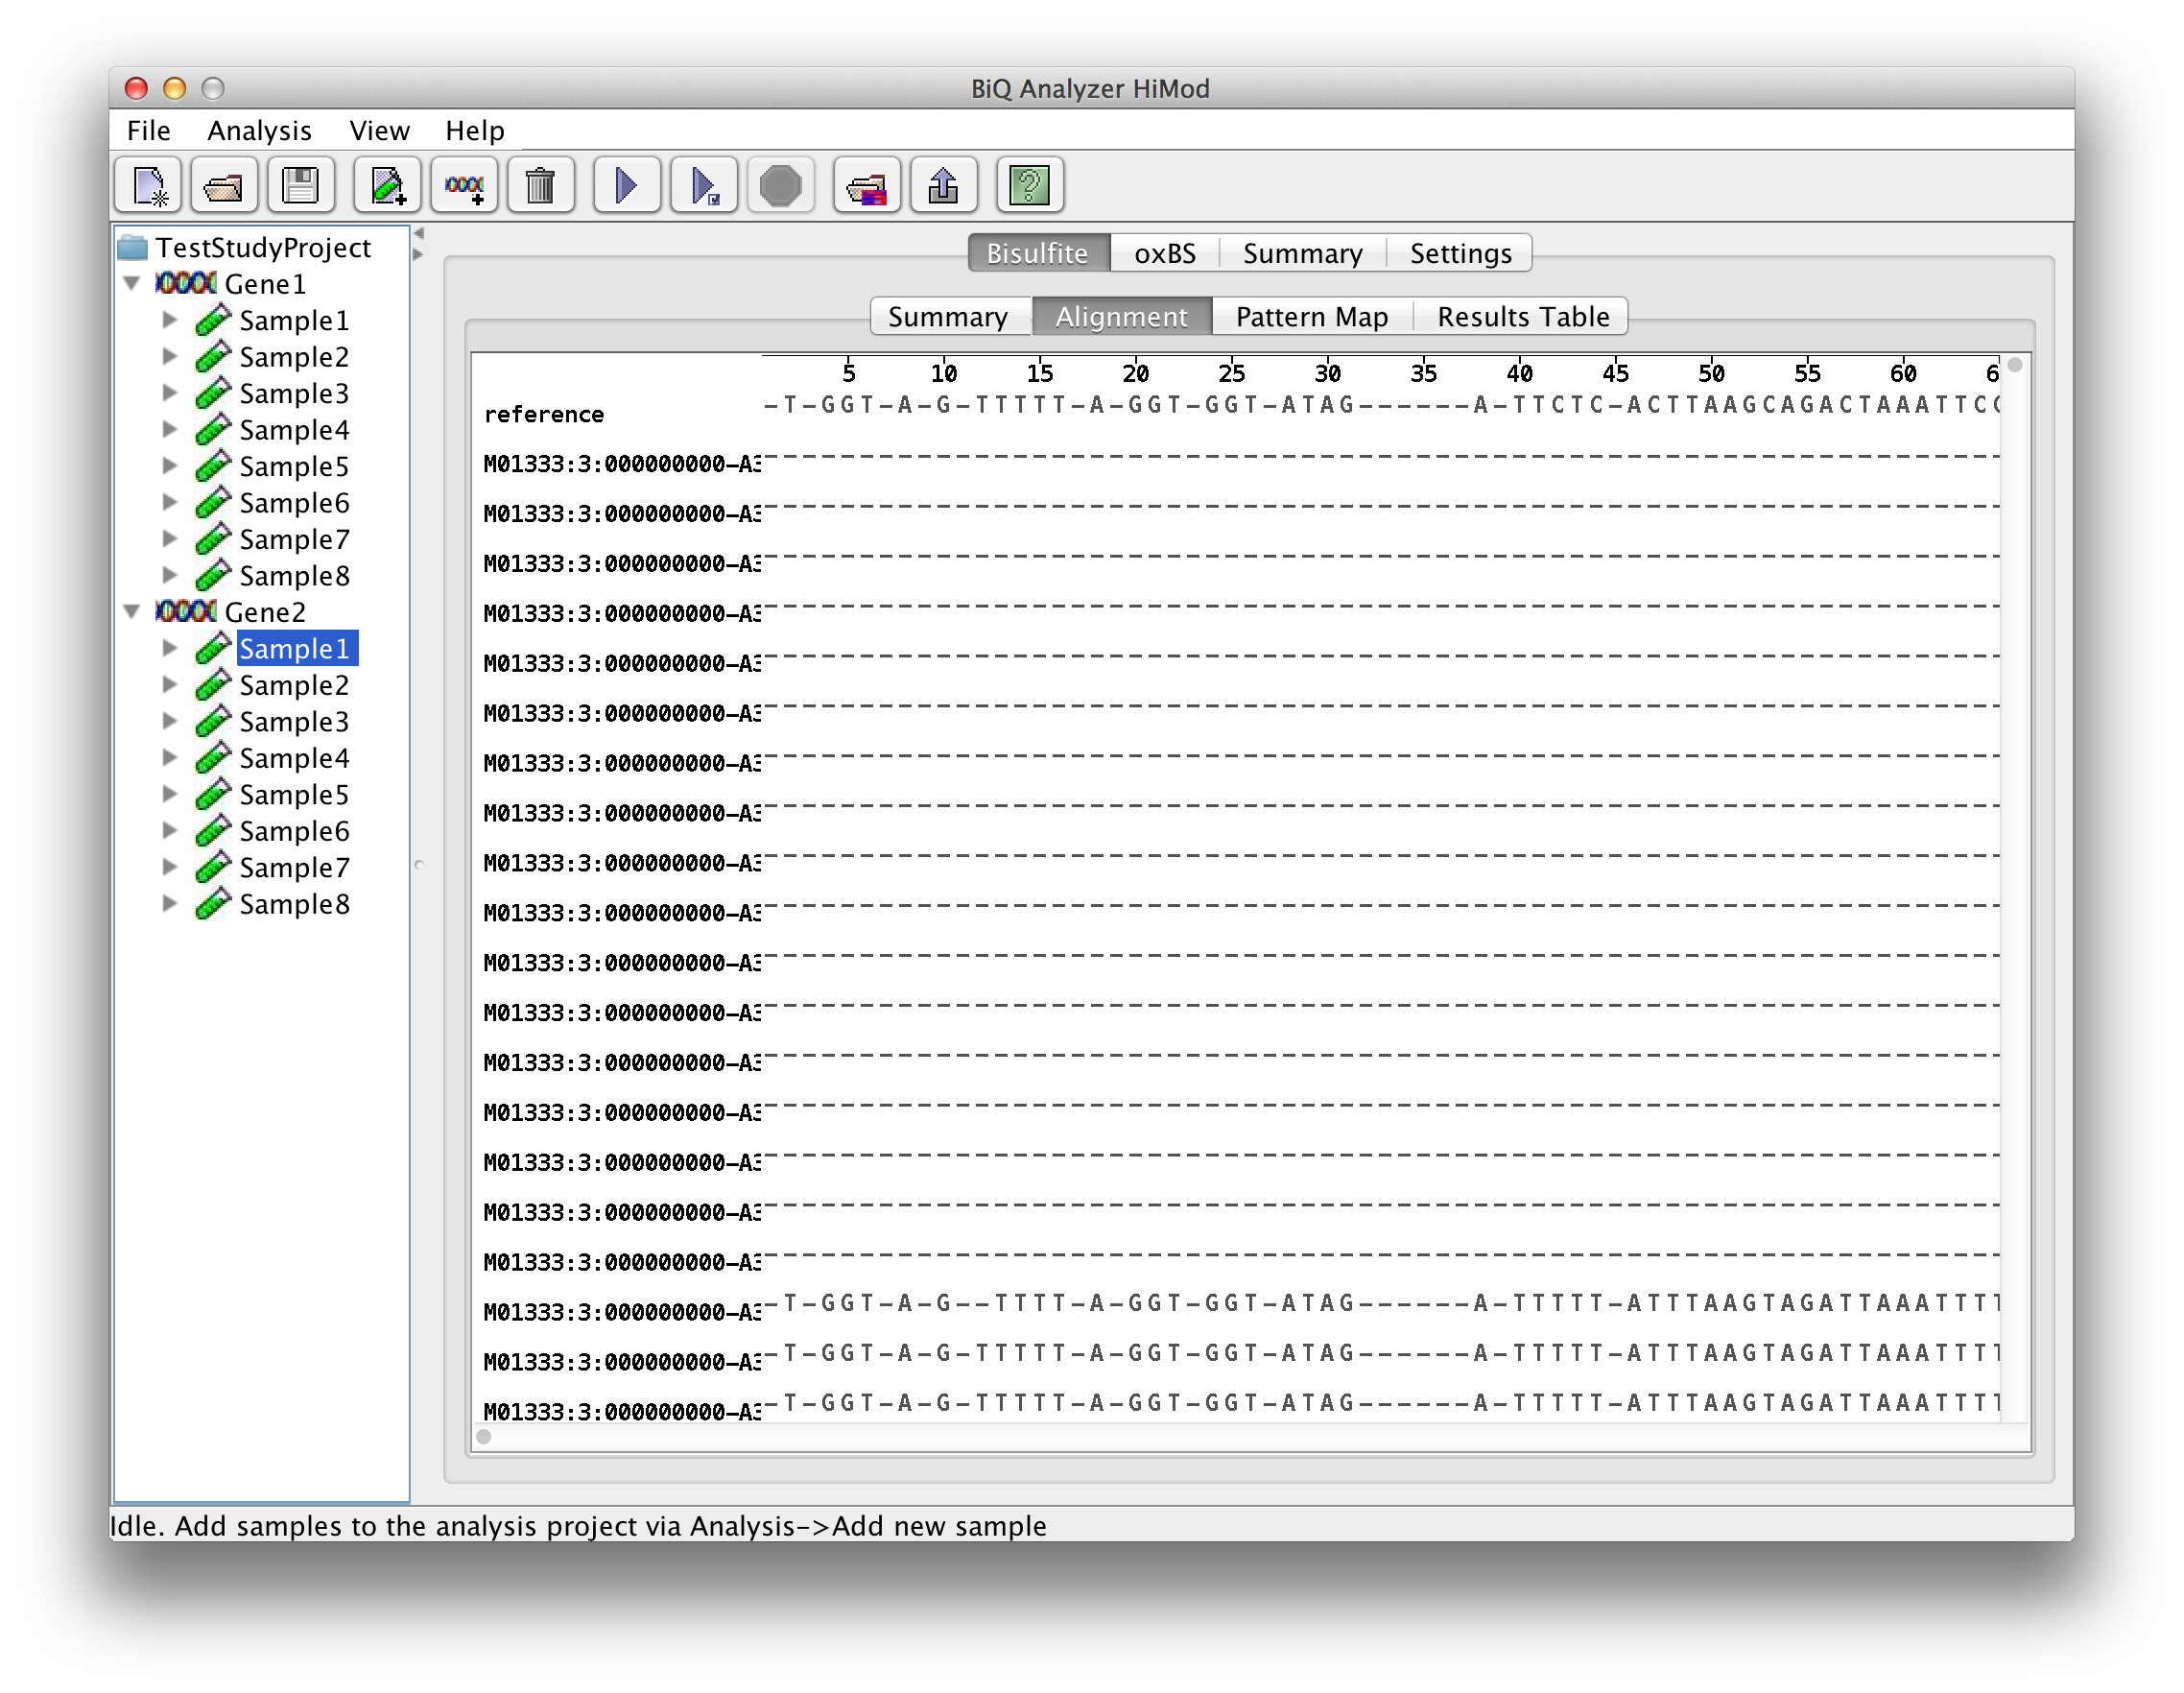
The alignment viewer allows to inspect a quasi-multiple alignment of the sequence reads to the reference sequence of the bisulfite sequenced amplicon obtained through the merger of pairwise alignments. The alignment has methylation sites highlighted in accordance with their states. Accelerated scrolling in the viewer is enabled by holding Ctrl while scrolling with the mouse wheel. |
|
 please click on the image to enlarge |
|
|
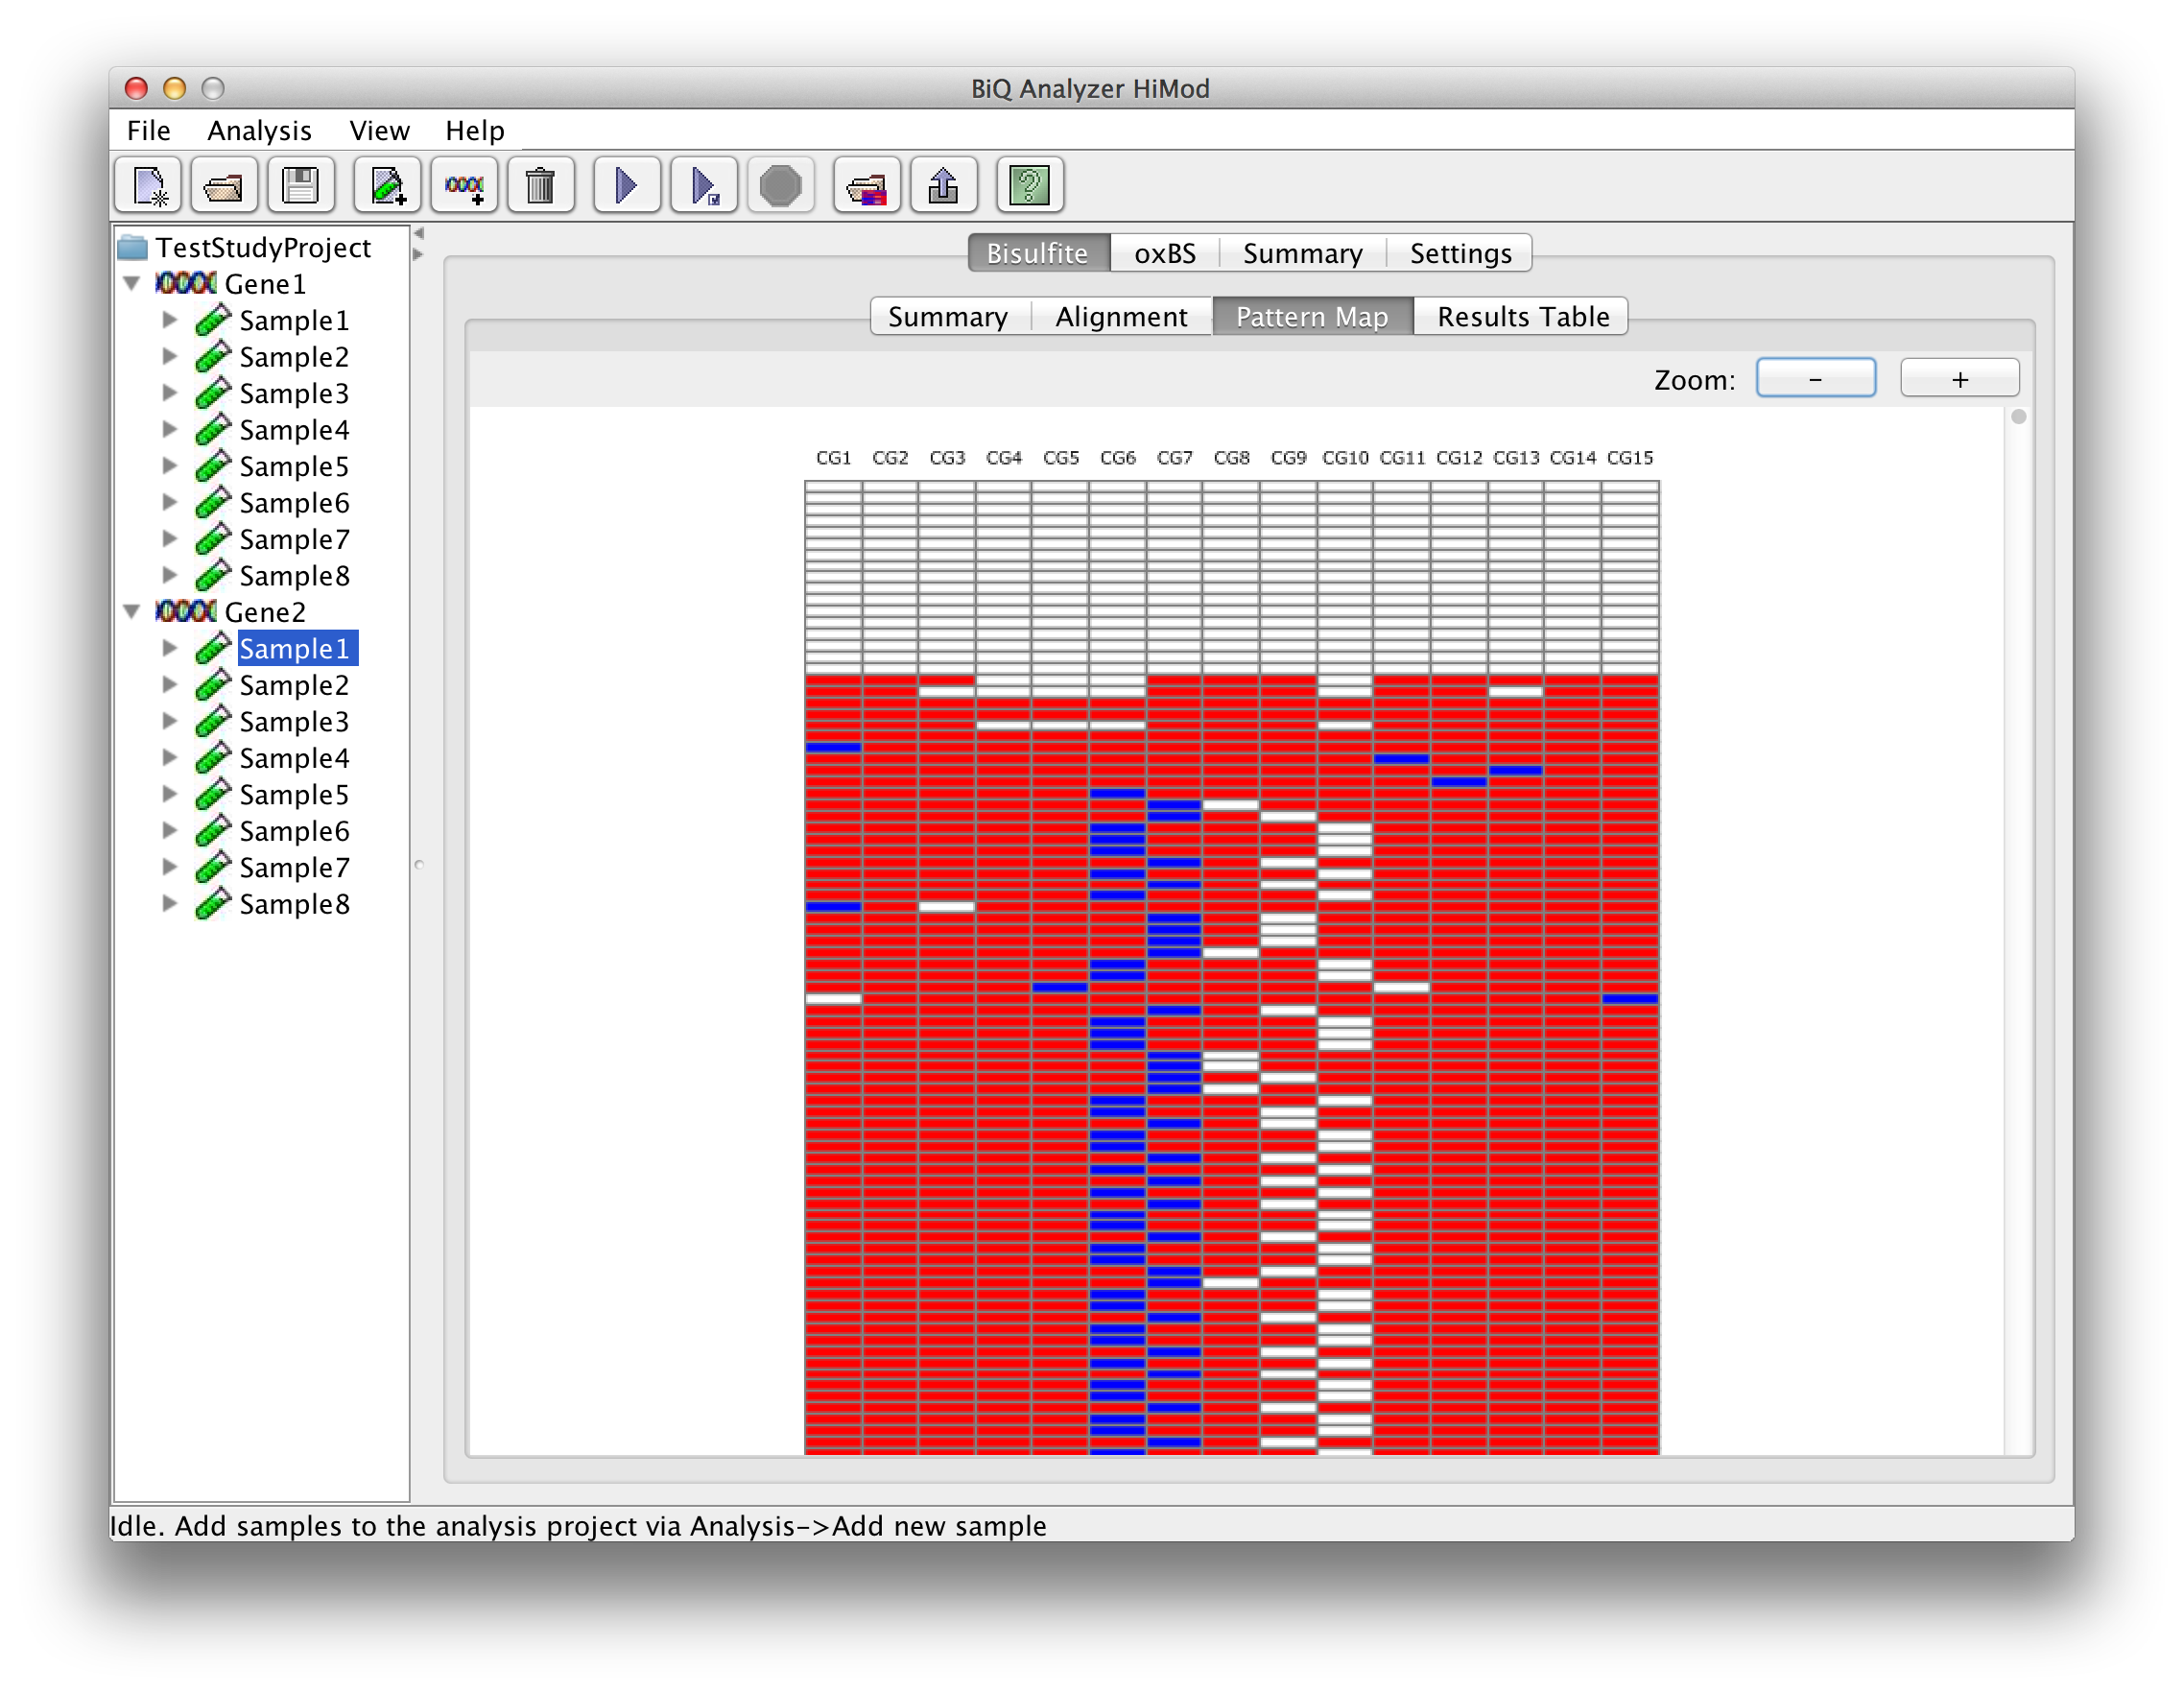
Methylation heatmap represents the extracted methylation patterns of the bisulfite reads graphically. Columns of the heatmap are formed by the methylation sites found in the reference sequence by matching the analyzed methylation context, while rows correspond to the sequence reads. |
|
 please click on the image to enlarge |
|
|
The table in the "Results" tab contains analysis information for each analyzed read that passed the filtering. The columns of the table correspond to the columns of the tab-separated file named results.tsv located in the corresponding subdirectory of the project output directory, and include alignment score, sequence identity, methylation pattern, mean methylation level and other headers. |
|
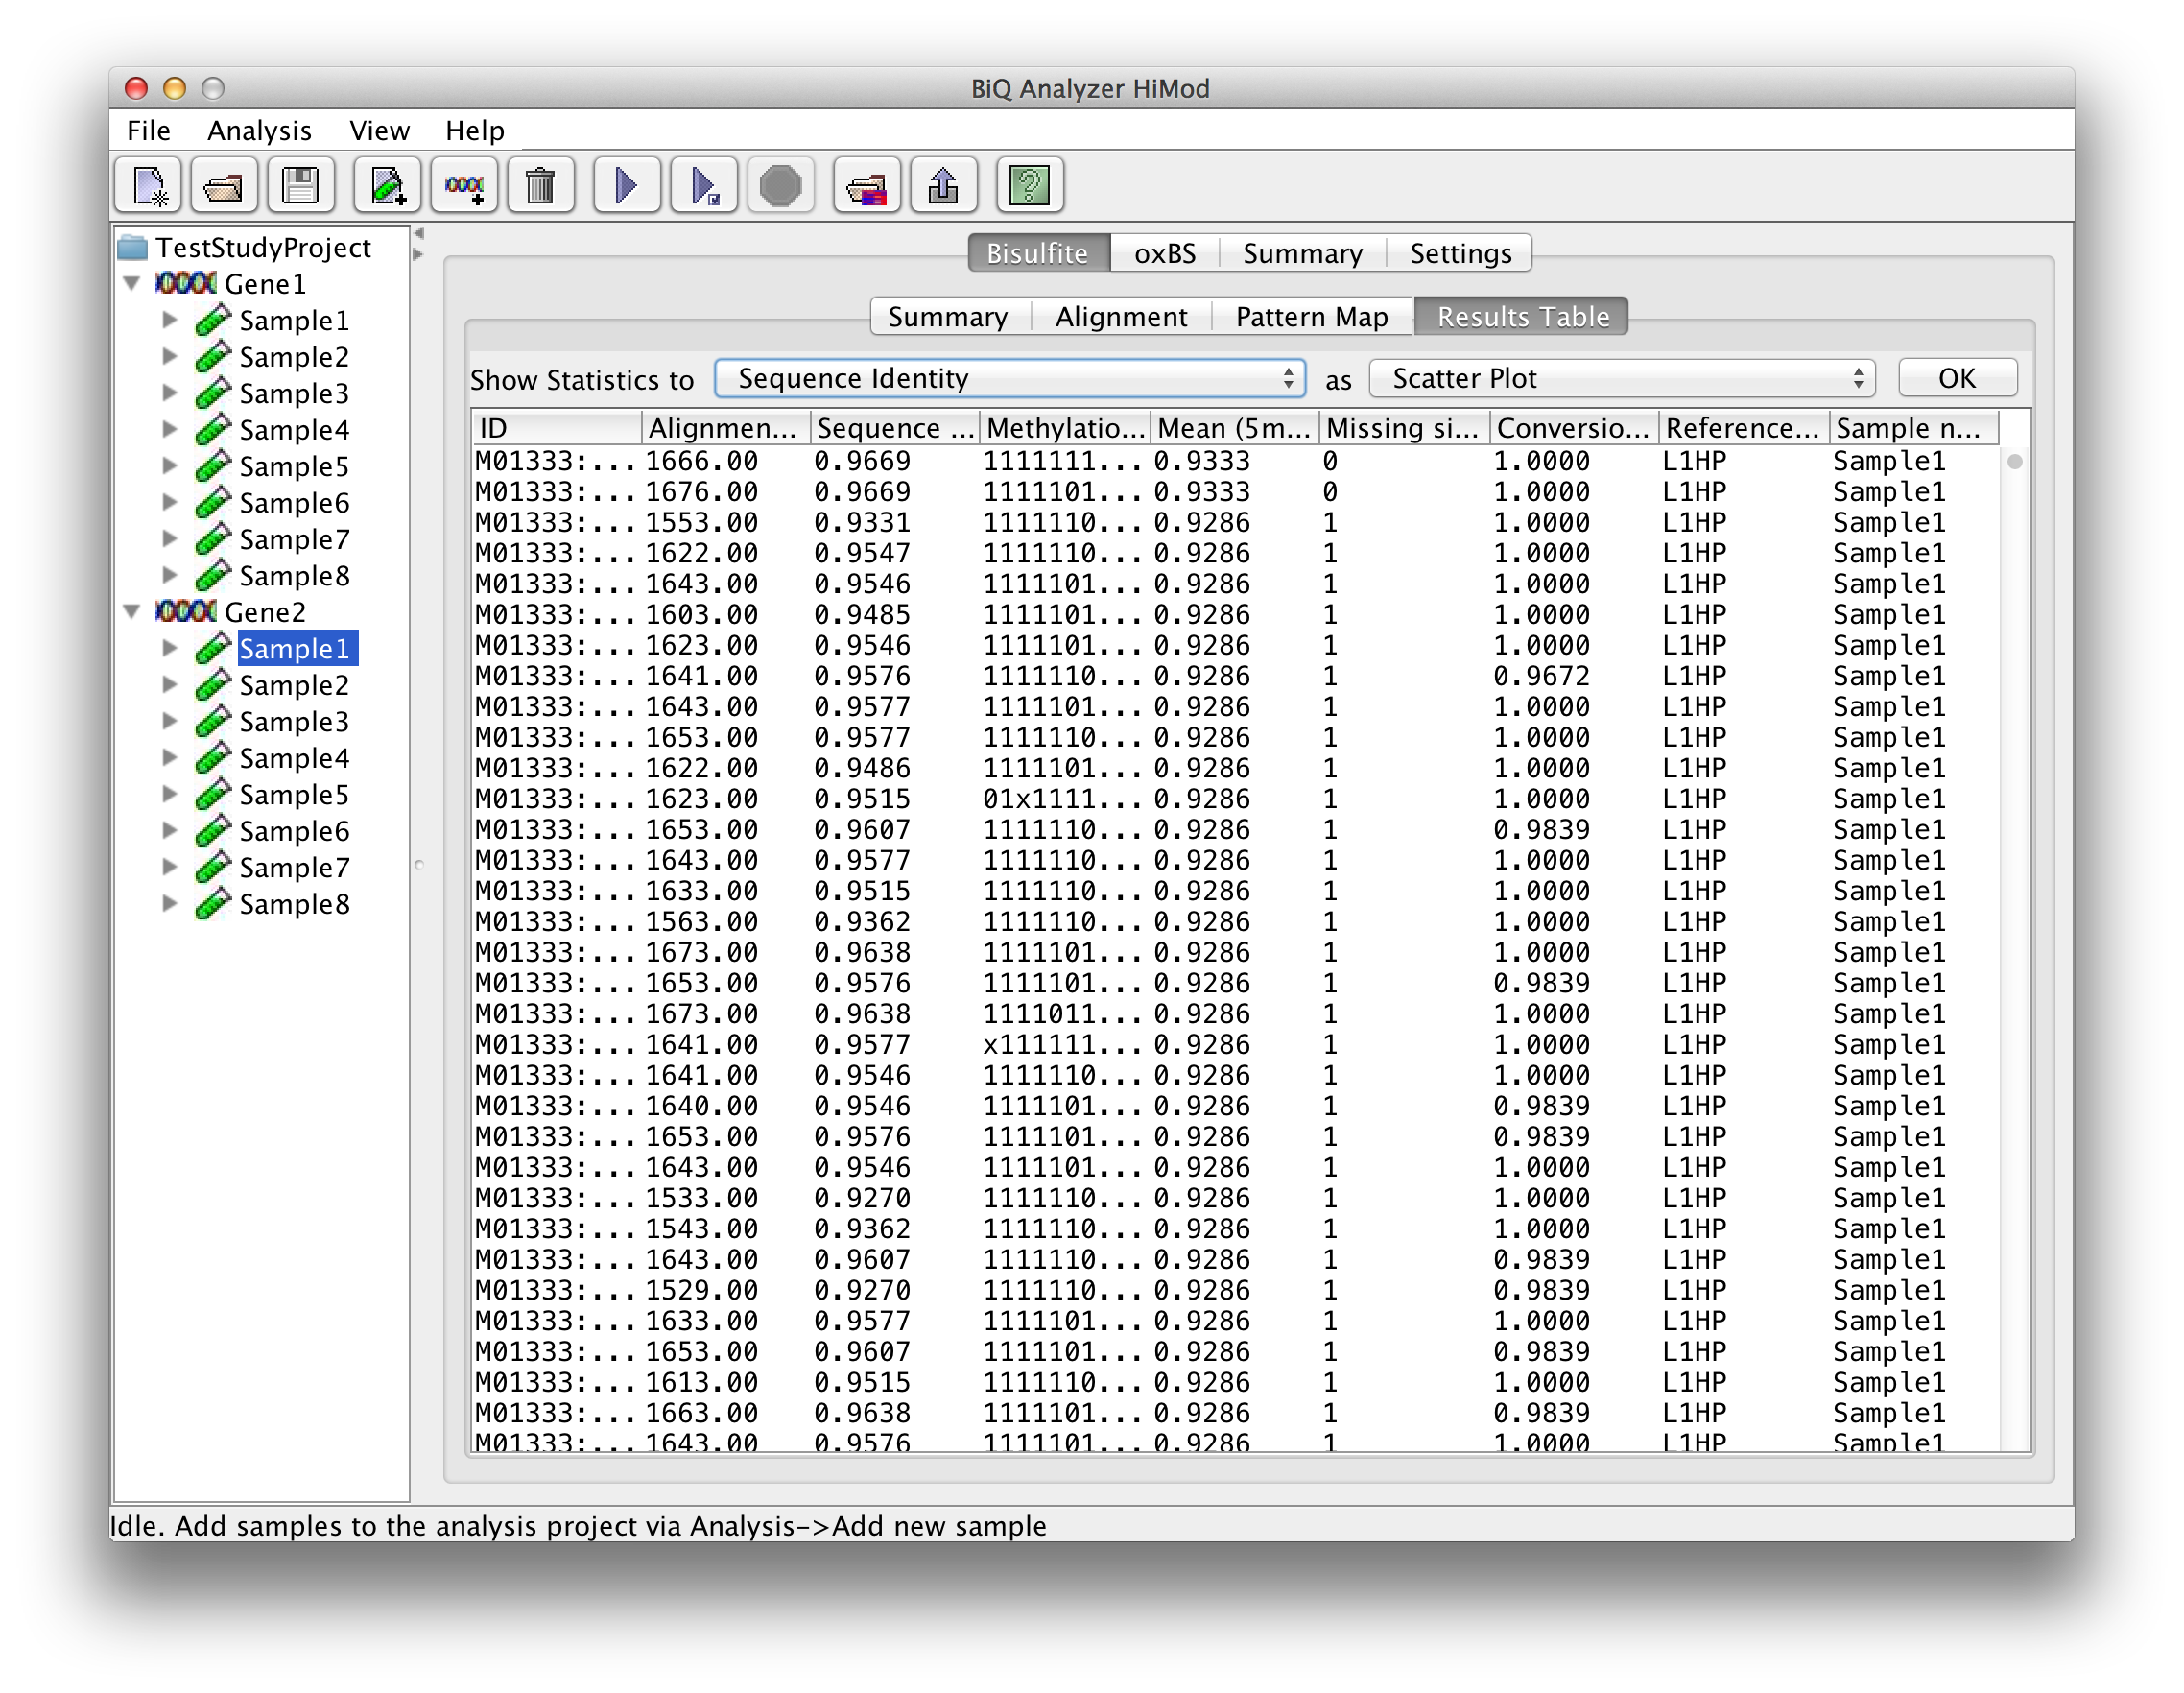 please click on the image to enlarge |
|
|
All of the above tables and graphics are already exported to the project folder. The state of the analysis project can be saved to the hard drive at any time point by selecting File -> Save project item in the system menu or pressing a respective button in the toolbar. Thus the analysis can be resumed later. |
3. BiQ Analyzer Command Line Interface
BiQ Analyzer features a command line interface. To trigger BiQ Analyzer to the command line mode the executable BiQ5HiMod.jar should be started with the "-nogui" argument in the following way:
Note that java executable files should be on the System Path (this quick guide explains how to achieve this). The list of all available options is accessible via "-help". The command line interface follows the POSIX specification. The minimal set of required arguments includes "-rseq" (genomic reference sequence in a single FASTA file) and "-bseq" (bisulfite sequence reads in one FASTA file or a as a directory of FASTA files). Output directory name can be specified with "-outdir". By default BiQ Analyzer creates an output directory named "analysis_run". The output directory contains the following result files:
- summary.dat, a short summary of the analysis run.
- results.tsv, a tab-separated table with the processing and analysis results (a row per each analyzed read)
- heatmap.png, methylation heatmap
- pearlNecklace.png, pearl necklace diagram, summarizing methylation information for each CpG
- sourceSequences.mfa, source FASTA sequences of the reads that passed the quality filters
- alignment.mfa, multi-sequence FASTA file containing multiple alignment of the bisulfite reads to the genomic reference sequence
The BiQ Analyzer command line interface is based upon the new methylation analysis API and offers more options for processing, filtering and analysis of bisulfite sequence reads. Several option groups exist:
- Alignment options ("-smat", "-gext") allow modification of the alignment algorithm parameters.
- Filtering options allow to set up maximal/minimal thresholds for quality measures (e.g. "-maxsi", "minsi").
- Sorting options ("-sortmisfrac") allow the user to set a criterion for sorting the output sequencing. By default the reads are sorted by methylation level.
4. Troubleshooting
This project is in the beta state, and may still contain serious bugs. Several major points exist where BiQ Analyzer may fail:
- Memory limitations
- As the number of sequences grows the data structures that store the
sequence pileup may exceed the available Java heap space. In case it
reaches the order of 20k and more the user may want to expand the
default and maximal values of the Java heap space size. This is done
manually by editing the .bat file (Windows OS) or the shell script
(Unix-like OS) which launches the BiQ Analyzer which is located in the
BiQ Analyzer installation directory (usually C:/Program Files/BiQ
Analyzer HiMod/). The script essentially contains the following string:
java -jar -Xms2048m -Xmx2048m "<location>/BiQ5HiMod.jar"
The available heap space can be extended by increasing the numbers after the -Xms and -Xmx command line modifiers which specify the default and maximal size of Java heap space (in megabytes) respectively. - TBA
In case of exceptions and other unexpected behavior do not hesitate to contact us.
BiQ Analyzer Documentation
1. Guided Tour
Using BiQ Analyzer one will find a detailed explanation for each step. Furthermore, this Guided Tour presents commented screenshots from an exemplary DNA methylation analysis. Its purpose is to show new users how to use BiQ Analyzer.
WARNING: The guided tour is based on a previous version of BiQ Analyzer. Therefore, some details may look somewhat different in your version.
However, the handling of the program has not changed and after running through the guided tour you will find the new version perfectly straightforward.
Press here to start the Guided Tour